Monday, October 31, 2016

Is Amazon the go-to search engine this holiday season?

Almost everyone knows that the overwhelming majority (93%) of online experiences begin with a search engine, but when you're looking to finish off your holiday shopping list, what search engine do you go to? Amazon or Google?


In 2012, a Forrester report found that 30% of all online shoppers start research products at Amazon. Wordtracker even went so far as to say that “Amazon has not only topped Google as the number one shopping search engine, but has attracted droves of individual and corporate sellers to its marketplace.”


Apparently, not much has changed since that time.


A recent study at the start of peak season for ecommerce has revealed that online retailer Amazon has taken a huge lead and become the first place consumers go to find products.


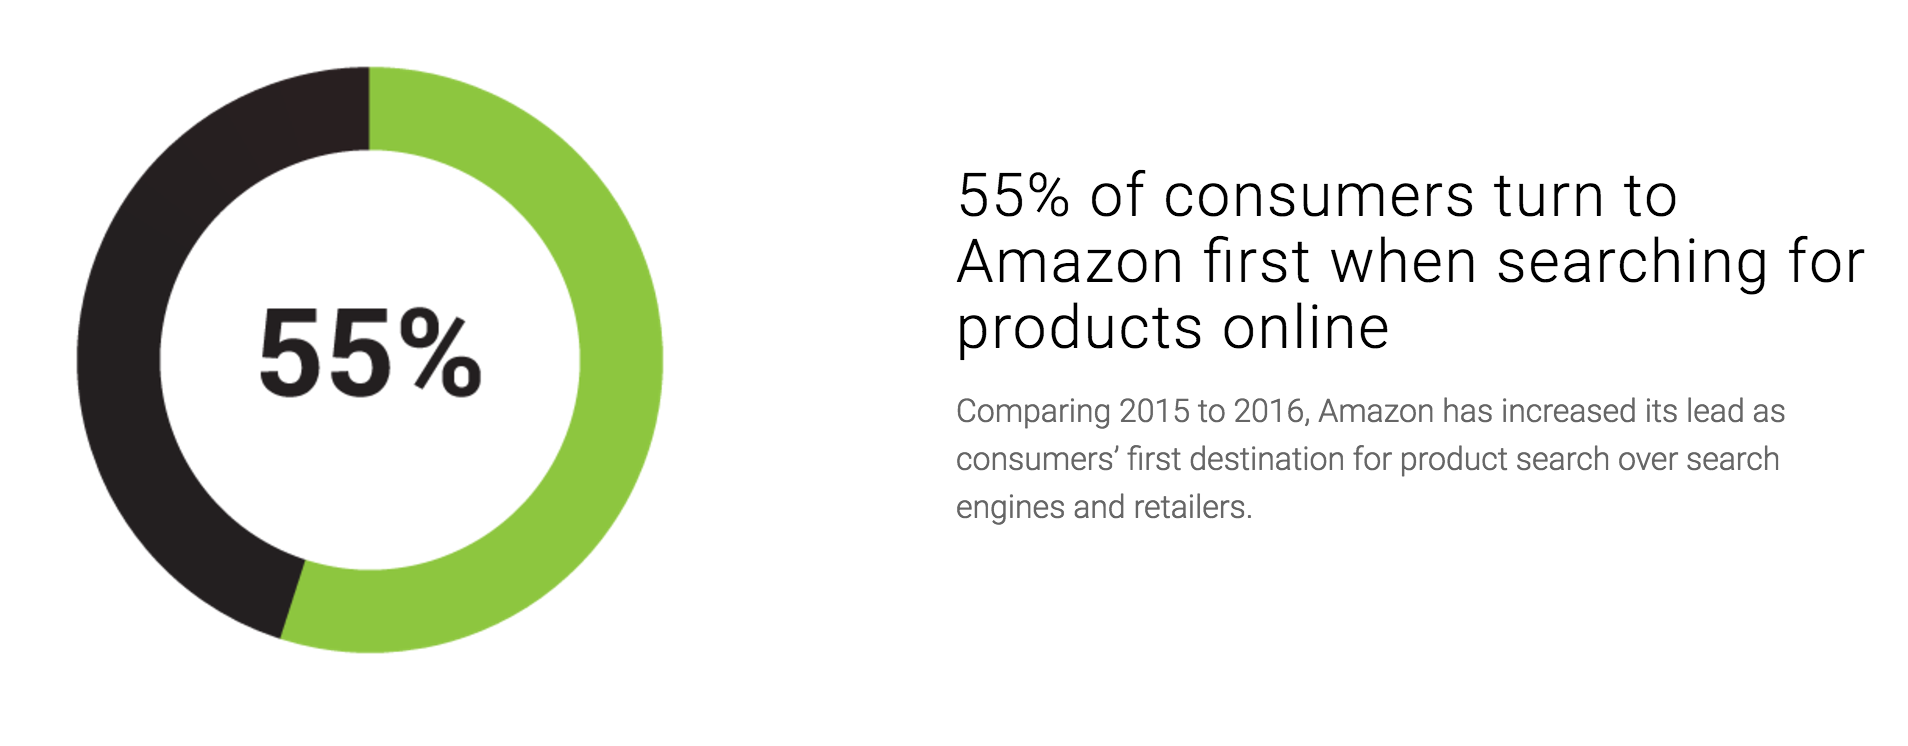
The study, run by personalization platform company BloomReach and Survata found that approximately 55% of customers use Amazon before any other site when searching for products online. This was the second annual “State of Amazon” study.


While the company's gains are impressive, it's nothing short of what consumers and researchers have come to expect from the retail giant.


In 2015, Amazon surpassed Wal-Mart as the most valuable retailer in the US, and its numbers only continue to grow. In the past, many more people would first turn to a search engine such as Google, but the number of services that Amazon offers puts the company at a distinct advantage for the coming holiday season.


The study


BloomReach's second annual “State of Amazon” study surveyed 2,000 U.S. consumers over the 2016 Labor Day weekend and revealed surprising results. While 55% of consumers reported going to Amazon before any other retailer, search engines and other retailers lost equal ground, pulling in only 28% and 16% of consumers, respectively.


bloomreach amazon stats


The company's lead has only increased since BloomReach's inaugural “State of Amazon” study, conducted in 2015. BloomReach conducted a similar study in April, which revealed that Amazon already possessed 53% of consumers' first product search.


As it turns out, Amazon is involved in nearly all online shopping experiences. In fact, approximately 90% of consumers will conduct a search on Amazon even if the product they want is on another retailer's site.


bloomreach amazon stats


“Amazon continues to be the first destination when consumers want to find a product, driven largely by a perceived superior end-to-end experience,” said Jason Seeba, BloomReach head of marketing. “Online shopping is all about relevance and convenience, and comparison shopping has never been easier – especially with mobile growth.”


The retailers


Amazon's grip on the public doesn't stop at general shopping, either. With the holiday season creeping upon us, the online retailer is expected to be the first destination for almost all online holiday shopping. Approximately 94% of consumers reported plans to complete their holiday shopping on Amazon, as well.


While retailers are feeling the pinch of Amazon's incredibly high consumer numbers, that doesn't mean they're entirely knocked out of the game. In fact, a majority of survey respondents said that other retailers were better at tailoring their websites and product recommendations.


Roughly one in five respondents reported that quality was their biggest concern while shopping at Amazon. It's relatively easy to buy some objects, but others face a high rate of counterfeit complaints.


In fact, the biggest complaints came from customers who used Amazon's relatively new “marketplace” feature. In an effort to compete with Etsy, another online retailer, Amazon created a third-party space for consumers to interact in much the same way they do on Etsy.


However, the growing artisan community came into Q3 2016 with a strong lead over Amazon's Marketplace.


Wal-Mart


Amazon may have some fierce competition online from the Etsy artisan community, but other retailers are struggling with their ecommerce for the holiday season.


Wal-Mart in particular is making a big push to expand their online presence as holiday season creeps ever closer.


However, investors are still looking for proof that the payoff will be worth all of the time and money in the end. The company stated that it plans to spend approximately $11 billion in its next fiscal year on ecommerce initiatives while still focusing on remodeling its stores.


walmart_exterior


Wal-Mart, while its ecommerce spending might be alarming, isn't new to this type of investment. In fact, its US online sales are second only to Amazon, the company it's currently attempting to surpass.


As one of the most successful brick-and-mortar franchises in the nation, Wal-Mart certainly doesn't have anything to fear as far as holiday sales go. The biggest issue for the company is whether its investors will see the current ecommerce spending necessary to compete with Amazon.


The shoppers


Whether it's brick-and-mortar retail shopping or it begins on a search engine, holiday creep has arrived. In fact, by the time Labor Day rolled around this year, nearly half of American parents had already started their holiday shopping.


Retailers like Macy's and Best Buy have already started their holiday advertising campaigns, even going so far as to deck out their stores in red and white holiday garb.


According to data from last year's Rubicon survey, only 42% of parents had started their holiday shopping by September. This year marks a significant increase in their data, although other studies reveal that Rubicon's numbers may run a bit high.


According to a CreditCards.com report from 2015, only about 14% of American consumers had started thier holiday shopping by September. However, their most recent survey showed the same upward trend in those consumers choosing to shop earlier in the year.


American parents are expected to spend approximately $1,711 during the 2016 holidays, according to Rubicon. And as the BloomReach survey suggests, most of them will be headed to search engines and Amazon for their initial searches.


According to the BloomReach “State of Amazon” study, when holiday shoppers have an idea of what they want, 59% will start on Amazon and 24% will start on a search engine. However, even a Google search is likely to direct consumers to Amazon before any other retailer.


Amazon's presence in the e-commerce community hasn't gone unnoticed by consumers, either. In fact, one in five consumers revealed they were concerned about the company's dominance relative to other retail outlets.


In conclusion


Amazon, while a powerhouse in the ecommerce community, still has a few issues of its own to work out. For one, its artisan-only Marketplace doesn't offer the kind of authenticity and service that sites like Etsy do. Consumers are not only concerned with counterfeit products, but with the company's dominance over the online community.


Nevertheless, the company hasn't pushed search engines or other retailers completely out of the holiday shopping game. A good chunk of consumers still turn to search engines before they conduct an Amazon search, although most search engines direct them to Amazon before other retailers.


Holiday shopping season has arrived, and although Amazon has its faults, 53% of consumers still report having left another website in favor of Amazon. This year's holiday shopping trends just may mark a huge milestone for the company.

Friday, October 28, 2016

Mobile paid search has increased by 134% since last year: stats

There has been an increase of 20% in the YoY growth of Google search ad spending in Q3 2016, while paid search mobile phone spend has increased by 134% from the past year.


This is according to Merkle's Q3 Digital Marketing Report, which covers the latest trends in paid search, social media, display, and organic search.


Here are some more useful stats on all the changes that occurred in the past year.


Paid Search


  • Google search ad spending grew 20% YoY in Q3 2016, although it's down from the 22% growth a quarter earlier. Click volume grew 28%, while CPCs fell 6%.


screen-shot-2016-10-27-at-21-52-11


  • Google Shopping (PLA) spending grew 36% YoY on a 59% increase in clicks. Google text ad spending rose 9% on 11% higher clicks.

  • Bing Ads and Yahoo Gemini combined search ad spending fell 14% YoY in Q3 2016, compared to a 17% decline in Q2. Bing Product Ad spending declined 12%, while Gemini's share of click volume across both platforms remained flat at 17%.

  • Total paid search phone spending increased 134% YoY, while both tablet and desktop spending fell 4%. Phones and tablets combined to generate 62% of Google search ad clicks, which is a 5% increase from Q2. Desktop CPCs rose 8% YoY in Q3 2016, while tablet CPCs were flat.


screen-shot-2016-10-27-at-21-53-35


Organic Search & Social


  • Total organic search visits fell 5% YoY in Q3 2016, although still an improvement from a 7% decline in Q2. Phone organic search visits increased 9% YoY, the first quarterly increase in 2016, while desktop visits fell 7% .


screen-shot-2016-10-27-at-21-57-24


  • Google organic search visits fell 1% YoY as the search engine's efforts to increase the monetization of its mobile search results continues to depress organic volume. Yahoo organic visits fell 21% YoY, while Bing visits fell 2%.

  • Mobile devices produced 48% of organic search visits, up from 46% in Q2, but still below the 57% of paid search clicks that took place on mobile devices.


screen-shot-2016-10-27-at-22-04-01


  • Facebook dominated social visits, producing 61% of all site visits generated on social media sites in Q3 2016, which combined to produce 4% of mobile site visits. 


screen-shot-2016-10-27-at-22-04-47


Comparison Shopping Engines


  • The eBay Commerce Network's share of total comparison shopping engine (CSE) spending continued to climb, reaching 65% in Q3 2016. Niche CSEs account for 6% of spending, while eBay's main rival in this space, Connexity, has seen its share fall to 29%.


screen-shot-2016-10-27-at-22-07-46


  • Mobile devices produced just 16% of CSE clicks in Q3 2016, similar to the rate observed in Q2, but well below the over 60% rate for Google Shopping.


Display Advertising


  • Total display and paid social advertising spending rose 46% YoY in Q3 2016, with Facebook dominating with a 63% YoY increase. Facebook CPCs continued to decline YoY, although the average CPM rose 38%.


screen-shot-2016-10-27-at-22-05-24


  • The Google Display Network (GDN) accounted for 8% of advertisers' total Google advertising investment, a small decline from a year earlier.

  • Facebook advertising spend was up 63% in YoY in Q3, which accounts for one of the highest rates of growth of the past years.


screen-shot-2016-10-27-at-22-06-11


For more information check out Merkle's Q3 Digital Marketing Report.

Thursday, October 27, 2016

Paid search click-through rates have risen 38%

According to data collected in Q3 2016, paid search CTRs have risen 38%, mainly in thanks to Google killing off its right-hand-side ads back in February.


More advertisers have also started to use Google's new extended text ads, accounting for 29% of search spend in September.


q3 2016 search spend


These stats are taken from Kenshoo's latest analysis of more than 750 billion impressions, 13 billion clicks and $6 billion (USD) in advertiser spend.


One of the major advertising trends in the last few months has seen online retail advertisers increasing their use of specialised product-focused ads on Facebook, Instagram and Google.


Video advertising on social media has also increased dramatically and mobile continues to be a key driver of growth.


Here are some more stats from the research:


  • Spend on Dynamic Product Ads on Facebook and Instagram, introduced in 2015 to help online retailers promote multiple products through social, has nearly doubled (up 95%) since Q4 2015. DPA now makes up more than four out of every ten clicks (42%) and 21% of spend on online retailers' social ads.

  • Search advertising spend on retailers' Product Listing Ads (PLAs), which include product images and information appearing in the “Shop for” boxes in Google search results, has shot up 87% in a year.


  • PLAs now account for 37% of online retail search clicks and 22% of spend, with 59% of clicks coming from smartphones.

  • Spend on social video ads, available on both Facebook and Instagram, has increased 155% in a year and video now accounts for 22% of social ad spend

  • CTR on social ads is up 21% since last year.


  • Social ad spend directed at mobile has increased by 61% YoY with mobile devices now accounting for 70% of all paid social clicks.


  • In search, mobile spend and clicks are up 39% and 48% respectively since last year. Mobile now accounts for 35% of all search spend and 43% of all clicks.


search stats from q3 2016


For more information, check our Kenshoo's latest infographic.

Wednesday, October 26, 2016

3 Things To Do To Get Leads


via Work with Marvin

Bing Ads reveal the most searched Halloween costumes

Halloween in the digital age involves a significant amount of searching until the right costume is picked. So what can we learn from this year's searches?


Online search is the most popular way to discover a Halloween costume nowadays, as according to National Retail Federation, 35% of adults rely on searching to find their costumes.


Bing examined the trends on the searches from September to mid-October and it found that adults are actually more interested in performing such searches, compared to teens.


32% of the searches were made from people aged 35-49 and 28% of them were made from people aged 50-64. This is probably the reason why 72% of the searches occurred on PCs, with just 14% of them taking place on both tablet and mobile devices.


1-1-edit


Halloween costume trends by age


Different age groups lead to different costume searches and apparently every generation has its own preferences:


  • Teens aged 13 to 17 are 473% more likely to search for Pokémon, compared to young adults aged 18 to 24.

  • Young adults aged 18 to 24 are 8% more likely to search for Little Mermaid than Deadpool.

  • Adults aged 25 to 34 are 10% more likely to search for Deadpool than Little Mermaid.

  • Adults aged 35 to 49 are 242% more likely to search for Harry Potter, at least compared to 25-34-year-olds.

  • Baby Boomers and Gen Xers aged 50 to 64 are 8% more likely to search for Alice in Wonderland than Pokémon.

  • Older Baby Boomers aged over 65 are both likely to search for Five Nights at Freddy's and Deadpool.


Most popular superhero searches


There's no surprise that the most popular search among comics and superheroes was “Suicide Squad” as its popularity (and the variety of costumes) reached a wide audience.


1-4


Most popular movie and TV costume searches


Star Wars is still the most popular choice in Halloween costumes, leaving behind Harry Potter and Ghostbusters, with Game of Thrones lacking the buzz it had the previous years.


1-2


Most popular Disney costume searches


Disney costumes are more about classic choices, for anyone feeling nostalgic enough to pick Alice in Wonderland, Little Mermaid, or Mickey Mouse.


1-5


Did any of these help you find your Halloween costume?

Tuesday, October 25, 2016

Is Google killing mobile organic search?

Click-through rates for websites depend a great deal on their position in organic search results.


But to what extent are local businesses further compromised as Google pushes all organic results further and further off the bottom of the mobile screen as it prioritizes paid ads, Google My Business listings, Knowledge Graph and/or Accelerated Mobile Pages?


And when directories, aggregators, articles, reviews and chains dominate the top organic slots, what hope is there that the mobile user will scroll two, three, four or more screens to find the website of the local restaurant or hotel they seek?


This is the first of two columns on the state of mobile search.


  • This column is focused on what's happening to mobile organic search – i.e. where websites come in the search engine result page (SERPS).

  • The follow-up column will consider the Google-owned properties – particularly Google My Business and Knowledge Graph – that are displacing organic results, including the impact as Google commercializes these businesses.


So burning question is: has Google killed mobile organic search? For these two columns ClickZ consulted five experts.


The answer (as you'd expect from inbound and local marketers and SEO specialists) is organic search is not dead, but there is no doubt that the game has changed immeasurably, and continues to change every time Google introduces a new innovation, including on-going changes to paid search, Google My Business listings, Knowledge Graph and its latest baby Accelerated Mobile Pages (AMP).


Andrew Shotland sums up the responses nicely:


Google hasn't killed organic search on mobile but it has certainly maimed it. There is still a large amount of traffic going to non-Google properties in local organic SERPs. Despite Google's continuing takeover of prime SERP real estate with its own properties, its algorithms still need to allow for a wide breadth of results because it still has to account different intents from a single query.


As shown in the Local Search Ranking Factors report (June 2016), Google treats “implicit” geo queries (searches like “pizza” that may have local intent but don't specify a geography) differently than “explicit” geo queries (e.g. “pizza in Chicago”). And while Google is generally pretty smart about what the most popular intents are, when it's fuzzy, they will need to provide a variety of results. So smart SEOs still have a lot to play with.


So what has Google done to organic search?


A. More paid search ads.


B. Prioritized Google My Business (GMB).


For a business-related Google mobile search, the priority for results is usually as follows – as demonstrated by results for “Restaurants in Mayfair”, below:


  1. Paid search ads (designated by a PL in the screenshots below) – up to four different ads for popular search queries in popular locations. These can be quite sizeable, including up to 10 lines of text or links.

  2. Google My Business (GMB) results – three local businesses (listed in Google's directory) are shown on a local map, then given an individual listing of four lines each. The listings do not correspond with the organic results below.

  3. Organic results (OL) – approx. 10 listings. For popular search terms such as “restaurants in X” or “Pizza nearby” the top ranking results are often dominated by aggregators such as directories, delivery services (if restaurants), articles, reviews and national/international chains – this may mean (as in the case below) that there are no restaurants on the first page of search results at all.

  4. More ads – often including ads for download native apps.

  5. Related searches – approx. eight listings of searches recommended by Google.


(Aside: a study of how these recommended searches relate to the keywords favored by advertisers would be a really interesting read).


  1. Option to see next page of results.


C. Prioritized Knowledge Graph


For a content-related Google mobile search, the priority for results is usually as follows – as demonstrated by results for “Mayfair”, below:


  1. Paid search ads (none present in the example).

  2. Knowledge graph (KG) – this is an expandable panel of information and images related to the search query, drawn from various sources e.g. Wikipedia and may include GMB-type listings (as shown below, these may be restaurants or hotels.)

  3. Organic results.

  4. Related searches.

  5. Option to see next page of results.


D. Accelerated mobile pages (AMP)


A further complication to organic search is AMP, which is a Google backed initiative to make mobile pages load faster. Currently these are mostly news stories (it has yet to gain much traction with business), and are usually displayed as a carousel of headlines and images.


Depending on the search term AMP results will come first, second behind paid ads, third behind ads and GMB or KG results, and sometimes among the organic results. Whichever, the effect is that organic results can be pushed further below the fold.


The following screenshots show two mobile searches conducted in London (results in different countries may bring different results). The fold line denotes where the visible screen ends (before scrolling) on large smartphones, such as Samsung Galaxy S6.


  • The first is for “Restaurants in Mayfair” – which shows how organic listings are pushed two+ screens down search results by three ads and the three Google My Business restaurant listings (notated by GMB in the image). These GMB listings do not correspond with organic search results. Also note the absence of any restaurants at all in the first page of search results.


  • The second search was for “Mayfair” – which shows how organic listings are pushed off the first page by Google's Knowledge Graph (KG). Interestingly the restaurants in the KG are different to those in GMB results for “Restaurants in Mayfair”, if expanded (not shown) KG also shows a carousel of hotels, these results are different to the GMB results for hotels in Mayfair.


Bizarrely, restaurants (RL) and hotels (HL) do better in organic results for “Mayfair” than “Restaurants in Mayfair” or “Hotels in Mayfair”. This may reflect the fact that the context is not what Shotland would call explicit.


dna33_mayfair_screenshots_2


Mobile search is different to desktop search


Organic search on the desktop has also been hammered by Google, but not as badly in all cases.


In February 2016 Google shifted paid ads from the right side panel to above organic results.


For content-related searches Google's Knowledge Graph (KG) has taken the place of the ads in the panel. This means that in situations where there are fewer paid ads, organic search results may be above the fold on a PC screen.


GMB would also fit well in the side panel, but instead it sits above the organic results, and below the ads, leaving the side panel blank. This means organic results are pushed down the page, and depending on the dimensions of the PC screen size, below the fold.


The disparity of PC screen sizes makes it difficult to estimate where the fold would fall on the screenshots.


dna33_google_desktop_mayfair


Why is Google doing this?


There are two motivations:


  • First, Google want to make more (even more) money from advertising and partner referrals.

  • Second, it wants to provide better answers to the searchers' queries – this we assume is partly motivated by expectations for growth of voice search. If it can achieve this without searchers leaving Google's properties all the better (for Google).


HubSpot CEO Brian Halligan:


I think there are two real changes that have happened with Google Search, since we started HubSpot 10 years ago:


  1. AdWords: 50% of above the fold v 100% above the fold… 


10 years ago, for most searches you got a few ads along the top and bunch of ads along the side of the results page. For that same search today, there are no ads along the side and the ads along the top cover the entire space above the fold on a regular computer and above the fold on a mobile phone. This means that if you want to get found in Google, paid is far more important than it used to.


  1. Organic: Research the answer v Give you the answer…. 


When we started HubSpot 10 years ago, for most searches, you just got a list of 10 links on the first page and the name of the SEO game was getting to the first page and as high as possible. Increasingly, Google is just giving you the answer to the question. The percent of queries I do where the answer is provided is going way up and the quality of those answers is very good.


Organic search isn't dead, by any means. The long-tail game of getting many keywords on the front page of the SERP still works, but increasingly you'll need to work to just be “the answer” to the query as opposed to one of the list of answers.


How are Google's changes impacting organic results? 


Click-through rates (CTR) for organic search fall as the position increases


All studies conclude that CTR declines the further down the SERPS the results is, but there is disagreement over the numbers and how this varies by the type of site and the search query.


The following table shows the results of a study by Authoritas (formally Analytics SEO) in 2015, which illustrates how rapidly the chance of traffic declines with each search position. Note the differences between desktop and mobile CTR per position and between search terms that relate to the brand and search terms that do not.


dna33_search_ctr_v_position


But what is the impact of paid ads, Google My Business and Knowledge Graph on organic CTR?


Unfortunately, there does not appear to be any research on the impact of Google move to monopolize the prime search real estate with its owned properties.


However a survey by ComScore and Localeze reveals that:


  • 72% of respondents perceived local search results most relevant, compared with 23% for organic results and a meager 5% for paid search results.

  • 67% – slightly fewer – perceived local results the most trustworthy, ahead of 26% for organic and 7% for paid.


If this sense of relevancy and trust influences click-through rates, as you would expect, then it is inevitable that Google prioritizing GMB results will impact organic search results.


The big question is: to what extent would that trust in local results be undermined if/when Google starts to introduce paid local listings? The impact of Google commercializing GMB and KG, we will consider in the next column.


dna33_trustworthy_search


Anecdotally, it appears that some sites have been hit harder than others by Google's changes.


Andrew Shotland:


The damage has been real. We have seen local organic traffic, particularly on mobile, for large sites trending downwards over the past two years. The big event was Google anchoring the Google My Business three-pack at the top of most local SERPs on both mobile and desktop from late 2015. We've definitely seen GMB cannibalize organic traffic to a far greater degree than paid ads.


When searching a local business name on a phone, there is now enough information on many of the Google My Business panels to reduce the need for a user to scroll to the organic results. This is great for local businesses that have a well-optimized GMB page. Not so great for everyone else trying to show you info about that business.


For other sites we still see growing organic search traffic and businesses are still getting a lot of conversions from organic mobile listings – particularly those who value phone calls. Even for those sites that have been losing overall organic traffic Google still knows to send you highly relevant traffic – the traffic that converts well – so sometimes conversions go up even as traffic goes down.


We're in it for the long tail.


While Google attempts to condition and steer searchers with recommended search queries – both as the term is typed and through related searches at the end of the results page (assuming anyone makes it that far) – and attempts to distract with paid ads, GMB and KG listings, Google will always try to deliver the best results for the query.


The more precise, relevant and frequent the terms used by the mobile user visa vie your sites keywords, the more likely the mobile searcher will be to find a listing for your site and the less clutter they will find in the way.


Will Critchlow, CEO, Distilled:


However much Google tries to give one-box instant answers, and no matter how much they monetize commercial phrases, so far, total mobile search volume is growing strongly enough that total organic mobile is growing as a channel.


It's really easy to forget the huge volume in the long-tail of search. In the long tail advertising is much sparser, one-box answers are less compelling, and the aggregators have much thinner content. It's even easier to forget this as keyword data recedes into the rear-view mirror in the form of (not provided).


Thus, in terms of tactics, we recommend moving further up the funnel, and capturing searchers earlier in the lifecycle, as well as beating out the aggregators based on your business' strengths and USPs – of course you will likely want to complement that with conversion-oriented paid search and appearing on appropriate aggregator / powerful sites as well.


SEO on its own may not be sufficient.


While SEO remains very relevant for mobile search, it should be used (as Critchlow also suggests above) as part of a coordinated marketing plan.


Kevin Cotch, SEO analyst at TopRank Marketing:


I do not believe that Google has killed organic search for mobile users. Google still shows the information that is the most relevant for the mobile audience including organic listings, but the SERP on a mobile phone is more limited. Google is typically showing more owned results (i.e. paid, local listings, featured snippets, etc.) with the limited space on mobile SERPs.  


I recommend approaching mobile with a unique strategy that targets where your audience is within the marketing funnel. Marketers should implement an integrated mobile strategy to attract, engage, and convert your target audience by incorporating SEO, paid, email, and social campaigns. Part of the mobile strategy related to SEO would utilize development resources to implement AMP, schema markup, and optimizing your website for site speed to enhance user experience. 


At the end of the day, Google will continue to change the SERPs to provide the best results. Search marketers will need to continue optimizing their integrated mobile strategy to get the most out of each campaign, including SEO.


The follow-up column to this one will consider the Google-owned and controlled properties – particularly Google My Business and Knowledge Graph – that are displacing organic results.


We will investigate what this means for your search strategy and web design and the impact of Google introducing sponsored results and prioritizing partner businesses


Read the reports:


Monday, October 24, 2016

How to make longer web forms easier for users

Some web forms have to be longer than normal. While an ecommerce site can limit the user entry to an email, delivery address and payment details, some sites need more information.


For example, forms on travel and financial websites have to be longer than most by necessity.


Long forms like this can be off-putting for users as they can give the impression that the process is going to be time-consuming.


For example, 13% of users abandon bookings on travel websites because the booking process is too long or overcomplicated.


So how can forms be made more palatable for users?


The look and feel of the form


It can be about the customer's perception of the form. If it looks like hard work, people will assume it is. This is one of the reasons why some websites use one-page or accordion checkouts, as even though they require the same amount of information as other sites, they can seem like less work.


One way to do this is by breaking up the form into more manageable segments. For example, Confused.com requires a lot of information for a car quote – job details, no-claims details, previous claims etc – but it does help to make it seem less work by breaking it up into sections.


confused1


Remove any unnecessary fields


One way to reduce form length, as previously mentioned, is to remove any unnecessary fields. Ask whether the information you need is really necessary to complete the process.


For example, the 'how did you hear about us?' fields in some web forms are just extra work for many. I doubt whether many people even take them seriously. Besides, analytics and other customer data sources should help you find the answer to this question.


how


Make data entry easier


There are ways to make things easier for users, simply by designing the forms more effectively.


Here, Confused.com opts for buttons rather than drop-downs for most fields. Also, on the occupation question, rather than making me choose from a list of job titles, it suggests roles as I type. This saves a lot of time.


confused2


Add shortcuts where possible


Small touches like allowing users to use delivery address details as their billing details help, and are now commonplace. Postcode lookup tools can also save time entering full addresses.


In-line validation


Well-implemented form validation assures that customers can correct any errors as they go along.


This saves time, as well as the frustration that results when customers attempt to move on to the next stage of the form, only to find they have errors to correct.


Here, HSBC presents a tick to confirm that some fields have been entered correctly, and clearly highlights those that need attention. (Taken from the Mapa Research guide to financial forms).


hsbc


Show time estimates for form completion


Some forms provide an estimate of the time it will take to complete a form.


It could be argued that this will deter some, but I think it's good to be upfront and give users an accurate estimate.


Here, Lloyd's provides an estimate before customers embark on its forms. (thanks again to Mapa).


hsbc lloyds-time


Save user details if they abandon


Where possible, saving user details already entered can really help. Perhaps they could save it to come back to later, or in case users bail out during the form.


Here, Confused.com tempts me back to the form I've abandoned with an email reminder. It also reassures me that it'll only take five minutes.


confused3


Think about mobile


Mobiles are increasingly used for travel bookings, so sites need to cater well for mobile users, making forms readable, and adapting to the user's device of choice.


Here, Hotels.com ensures that a) the calendar tool is easy to use (a common issue on mobile) and b) adapts for the kind of information required, so it shows the numerical keyboard for card entry (note that it also offers card scan for greater convenience).


img_3650img_3651


Our new Marketer's Guide to Form Optimisation, produced in association with Fospha, is free to download. 

Friday, October 21, 2016

What makes social videos so effective?

As video content in social media increases, how can brands use it more effectively?


Video consumption is on the rise and while users enjoy it, brands face the challenge of creating more effective video ads to stand out in the overcrowded social feeds.


How do you measure the effectiveness of a video in social media and what makes it appealing in just a few seconds?


IPG Media Lab partnered with Twitter to examine how social video works and we are highlighting the most interesting points from the report.


In-feed, auto play video for relevance and trust


Auto play video ads that show up in a curated feed are considered more relevant, trustworthy and non-intrusive, comparing to skippable pre-roll ads.


People seem to feel that relevant ads are less intrusive, which highlights the importance of targeting the right audience before delivering an ad to their feeds.


The better the targeting, the less annoyed people will be.


screen-shot-2016-10-18-at-18-36-38


Social video boost brand favourability


As in-feed video ads gain users' trust, they are also more likely to increase the brand's favourability, even with a single exposure to them.


Social videos seem to have greater impact compared to skippable pre-roll ads, despite the shorter time spent on them.


This means that brands need to capture immediately the audience's attention and deliver the best message from the very first seconds. It may be challenging, but it also leads to an increased ad recall.


screen-shot-2016-10-18-at-18-43-28


Viewability increases ad recall and awareness


Viewability, or else time in view, marks whether a video is interesting enough to appeal to the audience. The first three seconds seem to be important, as they serve as the critical point where users decide whether they should keep watching a video.


Thus, a brand has to be creative in less than three seconds to ensure that it captures the viewers' attention. The longer the view, the higher the awareness and the ad recall.


screen-shot-2016-10-18-at-18-47-07


Telling story early


As the first three seconds of a video are crucial, a brand should invest in a powerful message that is transmitted from the very first second.


An early story arc may be more persuasive if it conveys the right information as it can create the right context for the rest of the video. What's more, ad recall may be easier, linking the brand with the story.


screen-shot-2016-10-18-at-18-49-21


The impact of branding


There may be a general consensus on how excessive branding can negatively affect a brand's content, but this is not necessarily true for social videos.


When you have a few seconds to explain the aim of the video, heavy branding may be useful, as it manages to create the necessary association between the story and the brand.


The goal of every video is to improve a brand's awareness of a brand, or even to boost ad recall and if heavier branding can facilitate this process from the very beginning, then it may be a good idea to try it out.


screen-shot-2016-10-18-at-18-50-49


Takeaway


Video content is becoming popular, but its metrics still evolve, so every marketer should understand how videos differ from other types of content and how they should be measured.


Social videos will only grow more more popular, which means that it's important to define the right KPIs that will make them useful as part of your marketing strategy.


Keep in mind:


  • In-feed, auto-play videos are preferred by users, as they find them less intrusive. This is a useful way to build trust around your brand.

  • Always target the right people to increase the relevance of your content

  • Don't be afraid to include heavy branding in shorter videos. It might turn out beneficial for your content.

  • Tell a story with a clear message. The first seconds are very important.


After all, you can still monitor the latest trends in video marketing and examine how they can be personalised to work in your own campaigns.

Thursday, October 20, 2016

How to combine AdWords with Outbrain without cannibalizing their effectiveness

How different parts of the funnel can specifically incorporate two different channels – AdWords and Outbrain – while avoiding cannibalization.


There may be a portion of digital marketing professionals who remember a time when the number of channels were limited. Today though, there's many more channels than we really need, and each channel has a number of different options.


Although an omni-channel campaign will have one major objective, not every channel can be used in the same way, hence they need to be aligned so that they're playing to their own strengths.


There is a temptation to judge everything on the same metrics, but to do that will mean ignoring the nuances of each channel and removing any of those aforementioned strengths.


AdWords and Outbrain: differences and similarities


Let's take AdWords and Outbrain as examples. These are often seen as competing channels, even though they exist in distinctly different guises. It's a dangerous thing to run them both with the same expectations on what they're going to deliver at the end. The thing that can help you is to remember how they actually execute and target end users.


AdWords is predominantly about capitalising on a user's search intent. Your ads will appear just when a user is really looking for your products or services, and that is the perfect time to strike.


adwords


Outbrain is based around matching content by similar context.


outbrain-logo-vector-download


The belief here is that if a user is already reading or consuming content on a certain subject, they'll be interested in getting more of the same from another source. Clearly then, these two channels are very distinct in both their visuals, and targeting methods.


Interaction


The next step will be to understand how users interact with them, because that will tell you at what stage of the sales funnel they're most likely to be used at.


Whereas an AdWords practitioner can be reasonably confident about interpreting search query intent, an Outbrain optimiser is dealing with a bit more uncertainty.


As a result, you might want to assign Outbrain higher up the funnel than AdWords, where it can get broader reach and use the content to help nurture leads. AdWords, on the other hand, can be used towards the sharper end, as we can be surer of its users' intents.


Measurement


So now that we've understood the way they work, who they target and established their purposes, we can begin thinking about how these get measured. This is important, as it's ultimately the part that enables us to judge whether or not they're doing a good job.


For AdWords, the most sensible way to proceed would be to track final conversions. This could be shopping basket checkouts, newsletter registrations or ticket sales, whatever it is, it's the final action that you want your users to take and round things off. It makes sense because there are definitely instances where a final search engine query leads to the end.


As for Outbrain, because it's being used as a firehose to fill the funnel, its measurement metric needs to be a bit more abstract. In cases such as this, you need to ask questions as to how you measure the quality of the traffic.


It might be reducing the bounce rate percentage, or gauging it via the number of pageviews generated per session. An even better way would be to see how many instances Outbrain was responsible for starting, and then seeing how readily they turn into repeat visits.


By setting an objective in this manner, you'll be able to tie the channel to its strength of building brand presence through compelling content, rather than judging it on hard and fast conversions that it isn't built to do.


This is exactly the approach that we used for a client that was looking to drive registrations to their security event. As they had produced a lot of high quality blog content, it was used with Outbrain to deliver a high volume of users who had discovered it contextually.


It gave us a pool of users who we were confident would be interested in attending the event. AdWords was then used to specifically target those readers the next time they carried out another relevant search about the same issues and we were able to pick them off with highly targeted messages.


Obviously this is just one small example of how to integrate two distinct channels into one campaign. The same thought process can be applied to any number of channels, so long as you follow these takeaway pieces of advice:


  • Understand how each channel works, including the technology behind it

  • Think about how users interact with the channel, and thus the likely stage of the conversion cycle that they're likely to encounter it

  • That in turn will allow you to describe what you expect users to do afterwards, enabling you to assign a measurement metric to it


Mun Yin Liu is Digital Media Director at Text100 and a contributor to SEW. 

Monday, October 17, 2016

Five mobile must-haves to impact the customer journey this holiday season

According to Deloitte's annual retail holiday sales forecast, retailers should expect to see an uptick in both in-store and online sales this coming holiday.


With a stable economy, low unemployment and more disposable income, sales are expected to exceed $1 trillion, or a 3.6%-4% increase in sales over the same period last year (November-January).


That's good news for many retailers who have been forced to close some stores, streamline SKUs and reduce expenses, but it's no time to sit back and rest on the innovation front.


While most retailers have finalized their holiday plans by now, use the next few weeks to test, pilot and innovate to yield new learnings, insights and sales moving into the new year.


With that in mind, here are a few of my top recommendations focused on bridging the gap between digital and brick and mortar, improving the customer experience and keeping sales moving in the right direction.


Mobile is the bridge between digital and brick and mortar as the number of devices and time spent with those devices continues to accelerate.


Consequently, mobile is now the top digital marketing priority for marketers, according to Forrester Research. For marketers looking to further accelerate sales and improve customer experiences this holiday season, no program would be complete without a focused effort around mobile innovation spanning SMS, push, mobile advertising and location-driven marketing/intelligence.


Consider the following:


Text for save programs


Millions of consumers armed with smart phones in hand will be in and out of retail locations over the next few months. While many may not have downloaded your app, nearly all have the capability to text.


In fact, SMS remains the workhorse of mobile marketing because it's easy, real-time and ubiquitous.


Smartphone chatting SMS Messages speech Bubbles. Vector Illustration


Retailers seeking to increase year over year sales for a particular category or product should consider the following: analyze last year's average spend and margin for that category (i.e. $50), determine the desired increase in average sales/basket size and encourage users to spend more by texting in to receive a bonus or discount (i.e. spend $100, receive double rewards points).


Geo-triggered push notifications


Let's face it, they say timing is everything. If you're fortunate enough to have users download your app, you have a unique opportunity to not only learn more about them but to also connect existing data you have about those users via an in app purchase, registration or loyalty sign in.


Combining that knowledge with existing CRM data (i.e. past purchases) and when available, location will give you the ability to trigger a hyper-relevant message when a particular user crosses a geo-fence (i.e. within X feet of your retail location).


But why stop there? Consider testing a conquesting program by setting up geo-fences around your competitor location(s) and sweetening the deal to increase your share of wallet and loyalty.


Beacon/WiFi intelligence and messaging


There has been a lot of talk about the promise of Beacon and WiFi signals to support better customer knowledge, messaging and experiences in-store.


According to Retail TouchPoints, just 29% of retailers surveyed worldwide have implemented beacon technology thus far and of those who have, other research shows they are satisfied with them.


LED Display - Free wifi signage


The key to beacon success and satisfaction is to move forward with some goals in mind and setting up milestones and measures of success. Whether it is trying to get a better understanding of the customer journey in store, improving store operations via better data for staffing or impacting the experience and sales creating hyper-relevant offers and services in-store.


If you haven't implemented beacons yet, consider a pilot with those things in mind and be sure to share learnings internally to further fuel innovation.


Ad retargeting


As marketers, we all aspire to better understand and impact the customer journey in a positive way. After all, in the end, creating positive customer experiences is really how one brand can truly differentiate itself from another in today's competitive market.


So far, we've talked about pre-visit messaging with geo-location triggered messages and beacon/WiFi triggered messaging in-store, but what about post visit?


Using the IDFA (Apple Identifier for Advertiser) or Google Advertising ID, marketers have the opportunity to re-target their app users in app and via mobile ads across major ad ad networks.


By using CRM, geo-location data (recent store visit), beacon signals (in-store movements and linger time) and actual purchase data, marketers can now intelligently retarget users with hyper-relevant mobile ads that either reflecting interest or actual purchases (up-sell).


If access to various components of this effort is difficult, consider starting with testing a simple ad retargeting program to encourage another online or instore visit and move up in sophistication from there.


Mobile analytics and attribution


The wealth of data mobile offers is immense. The mobile landscape continues to expand with innovative start-ups focused on helping brands leverage the power of mobile and specifically mobile data.


Look for providers who can help you visualize this data to yield a better understanding of your customers based on their physical movements. One leading hospitality company I know, is using their app users location data off property to better understand and segment their users (i.e. foodie, sport enthusiast, etc.), inform on property services and refine messaging across all channels.


Location data can also be used to determine attribution – did that mobile ad drive an in-store visit and purchase?


We are living in exciting times and there is little doubt that mobile and mobile marketing is increasingly becoming central to not only understanding the customer journey, but impacting and evolving it in new and exciting ways.


While marketers continue to shift dollars towards the mobile channel, testing innovating new ways to impact the customer journey needs to be an essential part of any marketing effort today.

Friday, October 14, 2016

How the rise of user-generated content is changing marketing

User-generated content is becoming an important part of content marketing, with consumers forming a part of a brand's strategy. But how does this affect branded content?


I recently talked to Rachel Meranus, Chief Marketing Officer at Olapic about the popularity of user-generated content and the recent trends marketers need to know.


How do you see the future of earned content?


The rise of visual user-generated content (or earned content) has fundamentally changed marketing and the conversation brands are having with their customers. Consumers are becoming more skeptical of advertising and celebrity endorsements and are now demanding a more authentic dialog with the brands they love, and may even turn away if they don't feel they are getting it.


There is no better way to capture the voice of the customer than using the visual content they create and share on social channels, and integrating it into the marketing mix.


Research shows consumers are five times more dependent on content than they were five years ago, and brands are struggling to keep up with creating enough content to fill this need. The use of earned content  can ease the costly burden of producing elaborate campaigns while building customer loyalty and increasing engagement.


What's so appealing about UGC?


Authenticity resonates. As we have seen with Facebook and Instagram, people are interested in what their friends and family have to say about products they use. It is also because of these platforms that our eyes and brains are being retrained on a daily basis to see more 'real' photos from 'real' people.


Humans have an innate ability to spot a fake and when products are over stylized or staged, it does not ring true and we are automatically skeptical.  By placing products in real settings on average people, we can now see images that we as individuals can relate to.


The use of earned content offers brands a more genuine endorsement than traditional advertising, as it captures everyday consumers' true feelings about products and brands. Additionally, earned content is more easily available and affordable than content created directly by brands – in most cases, consumers will allow a brand to use their image at no cost.


How can a brand start with UGC?


If a brand is considering an earned content program, it's essential to develop a set of brand guidelines for identifying the types of content that makes the most sense for their brand. Marketers should also consider the role earned content plays across multiple channels – whether social, digital or offline – and use the mediums their audiences frequent.


Once these considerations are made, marketers should decide on a simple, unique, and branded hashtag. By encouraging shoppers to tag their purchases across all relevant channels, brands can identify compelling images, reach out to users for permission, and begin using these assets in their outreach.


content-1315878_1280


What should they measure as success?


To measure the success of a campaign, marketers must tie each piece of earned content to an analytics platform that can help them understand which content has the highest engagement rates, conversions, and increase in average order value.


Brands can evaluate earned content performance by analyzing click-through rates, the amount of likes, shares and comments a particular post receives, and the engagement that the content creator experiences him or herself.


Ultimately, this enables brands to identify the content that best impact overall sales and yield a better return on investment – while helping marketers build trust and inspire action from consumers at every touchpoint.


What's the best platform for earned content right now?


While consumers are increasingly serving as brand ambassadors across all social platforms, Instagram is leading the charge for earned content. The platform has successfully developed a community centered around user-generated images and videos, wherein everyday shoppers can turn to other consumers for ideas and inspiration along the path to purchase.


As an inherently visual content network, Instagram generates an average of 95 million consumer posts a day, often focused on people's favorite brands and products.


Consumers also tend to have a higher standard for sharing quality content on Instagram, given the platform's roots in photography. This provides brands with a wealth of valuable, genuine, and readily-available content, and marketers should leverage these posts to drive authentic engagement with their audiences.


What role will consumers play in branded marketing in the future?


Consumers have become exceptionally good at telling brand stories visually – often without solicitation. Marketing is fundamentally changing, and the brand-consumer conversation is demanding a new level of authenticity and trust.


Today's shoppers are not interested in generic experiences; they crave genuine content that demonstrates an accurate depiction of how a product or brand can be used by real people in a real world environment. Social media, specifically, plays a large role in driving more honest, human conversations.


As consumers continue to share content across these platforms daily, brands must embrace the customer voice and recognize the massively important role earned content in the marketing ecosystem – both now and in the future.

Thursday, October 13, 2016

The new wave of visual search: what it can do, and what might be possible

Visual search on the web has been around for some time.


In 2008, TinEye became the first image search engine to use image identification technology, and in 2010, the Google Goggles app allowed users to search the physical world with their phone cameras.


But in the last couple of years, visual search has come into new prominence, with companies like Pinterest and Bing developing into serious contenders in the visual search space, and search engines like Splash conceptualising new ways to search the web visually.


We now have an impressive range of visual search methods available to us: we can search with images, with part of an image, with our cameras, with paint on a digital canvas. And combined with applications in ecommerce, and recent advances in augmented reality, visual search is a powerful tool with huge potential.


So what can it do currently, and where might it develop in the future?


Then and now: The evolution of visual search


Although the technology behind image search has come on in leaps and bounds in the past few years, it's as a result of developments that have taken place over a much longer time period.


Image search on the web was around even before the launch of reverse image search engine TinEye in 2008. But TinEye claims that it was the first such search engine to use image identification technology rather than keywords, watermarks or metadata. In 2011, Google introduced its own version of the technology, which allowed users to perform reverse image searches on Google.


Both reverse image searches were able to identify famous landmarks, find other versions of the same image elsewhere on the web, and locate 'visually similar' images with similar composition of shapes and colour. Neither used facial recognition technology, and TinEye was (and still is) unable to recognise outlines of objects.


A screenshot of Google reverse image search in 2011. The search is for an image of some sandy yellow peaks and valleys with a blue backdrop. The results page says 'Best guess for this image: death valley national park zabriskie point'. The top two results are a Wikipedia page and a Tripadvisor page for Zabriskie Point, with a grid of visually similar images below.


Google reverse image search in 2011. Source: Search Engine Land


Meanwhile, Google Goggles allowed users of Android smartphones (and later in 2010, iPhones and iPads) to identify labels and landmarks in the physical world, as well as identifying product labels and barcodes that would allow users to search online for similar products. This was probably the first iteration of what seems to be a natural marriage between visual search and ecommerce, something I'll explore a bit more later on.


The Google Goggles app is still around on Android, although the technology hasn't advanced all that much in the last few years (tellingly, it was removed as a feature from Google Mobile for iOS due to being “of no clear use to too many people”), and it tends to pale in comparison to a more modern 'object search' app like CamFind.


A mobile screenshot of a Google Goggles search. The screen shows a small bottle of Carex antibacterial hand gel with skin conditioners. A green square surrounds the product label, and a text string at the bottom of the screen reads: with skin DRYING tioners Carex


You tried, Goggles.


CamFind is a visual search and image recognition mobile app that was launched in 2013, and while it doesn't appear to be able to solve Sudoku puzzles for you, it does have an impressive rate of accuracy.


Back when Google Glass was still a thing, Image Searcher, the startup behind CamFind, developed a version of the app to bring accurate visual search to Google Glass, activated by the command “OK Glass, what do you see?” This is the kind of futuristic application of visual search that many people imagined for a technology like Google Glass, and could have had great potential if Google Glass had caught on.


A mobile screenshot showing a successful CamFind object search. At the top is an image of a black keyboard. Below it is the word 'found'. Then reading downwards in a column are the words 'Black Lenovo corded keyboard'.


The CamFind mobile app has an impressive accuracy rate, even down to identifying the brand of an object.


When the 'pinboard'-style social network Pinterest launched in 2012, it was a bit of a dark horse, gaining huge popularity with a demographic of young-to-middle-aged women but remaining obscure in most conventional tech circles. Even those who recognised its potential as a social network probably wouldn't have guessed that it would also shape up into a force to be reckoned with in visual search.


But for Pinterest, accurate visual search just makes sense, as it allows Pinterest to serve relevant Pin recommendations to users who might be looking for something visually similar (say, the perfect copper lamp to light their living room) or hone in on the specific part of a Pinned image that interests them.


In 2014, Pinterest acquired VisualGraph, a two-person startup which was cofounded by one of Google's first computer vision engineers, bringing the company's visual search know-how into the fold. In the same year, it introduced and began refining a function that allowed users to highlight a specific part of a Pin and find other Pins that are visually similar to the highlighted area – two years ahead of Bing, who only introduced that functionality to its mobile image search in July 2016.


Bing has pipped Pinterest to the post by introducing visual searching with a smartphone camera to its native iOS app (I can't comment on how accurate it is, as the Bing iOS app is only available in the US), something that Pinterest is still working on launching. But it's clear that the two companies are at the vanguard of visual search technology, and it's worth paying attention to both to see what developments they announce next.


A gif showing Pinterest's visual search in action on a smartphone, detecting objects around a room and bringing up related pins at the bottom of the screen.


Meanwhile, Google is yet to offer any advance on Google Goggles for more accurate searching in the physical world, but you can bet that Google isn't going to let Pinterest and Bing stay ahead of it for too long. In July, Google announced the acquisition of French startup Moodstocks, which specialises in machine learning-based image recognition technology for smartphones.


And at Google I/O in May, Google's Engineering Director Erik Kay revealed some pretty impressive image recognition capabilities for Google's new messaging app, Allo.


“Allo even offers smart replies when people send photos to you. This works because in addition to understanding text, Allo builds on Google's computer vision capabilities to understand of the content and the context of images. In this case, Allo understood that the picture was of a dog, that it was a cute dog, and even the breed of the dog. In our internal testing, we found that Allo is 90% accurate in determining whether a dog deserves the ”cute dog” response.”


Visual search and ecommerce: A natural partnership


How many times have you been out and about and wished you could find out where that person bought their cool shoes, or their awesome bag, without the awkwardness of having to approach a stranger and ask?


What if you could just use your phone camera to secretly take a snap (though that's still potentially quite awkward if you get caught, let's be honest) and shop for visually similar search results online?


Ecommerce is a natural application for visual search, something which almost all companies behind visual search have realised, and made an integral part of their offering. CamFind, for example, will take you straight to shopping results for any object that you search, creating a seamless link between seeing an item and being able to buy it (or something like it) online.


A mobile screenshot from the app CamFind. At the top is a picture of a small bottle of Carex anti-bacterial hand gel, rotated 90 degrees to the left. Text at the top reads 'Carex Moisture Plus Hand Gel'. Below this are web results and related images for Carex Moisture Plus Hand Gel.


Pinterest's advances in visual search also serve the ecommerce side of the platform, by helping users to isolate products that they might be interested in and smoothly browse similar items. An 'object search' function for its mobile app would also be designed to help people find items similar to ones they like in the physical world on Pinterest, with a view to buying them.


With the myriad possibilities that visual search holds for ecommerce, it's no surprise that Amazon has also thrown its hat into the ring. In 2014, it integrated a shopping-by-camera functionality into its main iOS app (and has since released the function on Android), and also launched Firefly, a visual recognition and search app for the Amazon Fire Phone.


Even after the Fire Phone flopped, Amazon refused to give up on Firefly, and introduced the app to the more affordable Kindle Fire HD. The visual search function on its mobile app works best with books, DVDs and recognisably branded objects, but it otherwise has a good rate of accuracy.


A screenshot of Amazon's visual search for its mobile app in action. The main part of the screen shows the cover of a book, The Master Switch by Tim Wu. A collection of bright blue points clings to the title and author, and a tick icon shows that the app has successfully identified the book.


Amazon's visual search in action.


Other companies operating in the cross-section of visual search and ecommerce which have emerged in the past few years include Slyce, whose slogan is “Give your customer's camera a buy button”, and Catchoom, which creates image recognition and augmented reality tools for retail, publishing and other sectors.


Although searching the physical world has yet to cross over into the mainstream (most people I've talked to about it aren't even aware that the technology exists), that could easily change as the technology becomes more accurate and increasingly widespread.


But ecommerce is only one possible application for visual search. What other uses and innovations could we see spring up around visual search in the future?


The future of visual search?


Aside from the fairly obvious prediction that visual search will become more accurate and more widespread as time goes on, I can imagine various possibilities for visual search going forward, some of which already exist on a small scale.


The visual recognition technology which powers visual search has huge potential to serve as an accessibility aid. Image Searcher, the company behind CamFind, also has an app called TapTapSee which uses visual recognition and voiceover technology to identify objects for visually impaired and blind mobile users. Another app, Talking Goggles, performs the same function using Google Goggles' object identification technology.


Although these are purely recognition apps and not search engines as such, Image Searcher have used a great deal of the feedback they receive from the visually impaired community to integrate the same features into CamFind. It's easy to imagine how the two concepts, if developed in tandem, could be used to provide a truly accessible visual search to visually impaired users in the future.


And if camera-based visual search were combined with recent advances in voice search and natural language processing, it's possible to imagine a future in which the act of searching visually becomes virtually interface-free. Sundar Pichai, CEO of Google, demonstrated a very similar capability at Google I/O when he showed off Google's new voice assistant, Google Assistant.


“For example, you can be in front of this structure in Chicago and ask Google, ”Who designed this?” You don't need to say ”the bean” or ”the cloud gate.” We understand your context and we answer that the designer is Anish Kapoor.”


In this example, the unstated context for Pichai's question “Who designed this?” is likely provided by location data, but it could just as easily be visual input, provided by a smartphone camera or an improved Google Glass-like device.


I mentioned something called Splash earlier on in this article. Splash, a search interface developed by photo community 500px, is a different type of visual search than any we've looked at so far. The interface is designed to allow users to visually search 500px's image library using colour, digitally 'splashing' the paint onto a canvas.


As far as visual search engines go, Splash is more of a fun novelty than a practical search tool. You can only search for images in one of five categories – Landscape, People, Animals, Travel and City – so if you want a picture of something that doesn't come under one of those, good luck to you. The search results also tend to respond more to which colours are on the canvas than to what you're trying to depict with it.


A screenshot of Splash visual search in action. The canvas at the top shows a blurry, MS Paint-style depiction of a purple sky with a crescent moon and stars. The grid beneath it shows thumbnails of purple-hued images, showing beaches and mountains. None of them resembles the canvas.


Not really what I was after…


Even so, I like the different take that Splash gives on searching visually, and I think that the idea has a lot of interesting potential if it were developed and refined more. Other types of visual search that we've talked about so far depend on having a picture or an object to hand, but what if you wanted to search for something you knew how to draw, but didn't have an example of to hand?


Another thing I would find incredibly useful in my work as a journalist (where I'm often called upon to source stock images) would be the ability to search for a visual concept.


Say I'm looking for a picture to represent 'email ROI' for a piece I'm writing. It would be really helpful if I could run a visual search for any images which combined visuals relating to email, and visuals relating to money, in some way. Maybe a keyword-based search could get close to what I need, but I think a visual search would be able to cast a wider, and more useful, net.


Finally, if developing visual search continues to be a priority for companies like Pinterest, Bing and Google, I think the most natural evolution of the technology would be to incorporate augmented reality. AR is already advancing into the mainstream – not just with Pokémon Go, but apps like Blippar which fuse AR with visual discovery and visual search to add an extra dimension to the world around us.


There's clear potential for this to become a fully-fledged search phenomenon, say with text overlays providing information about objects you want to search for, and the ability to interact with items and purchase them, removing even more friction from ecommerce and enabling users to buy things in the moment of inspiration.


I don't foresee visual search replacing the text-based variety altogether (or at least, not for a very long time). But does opens up a world of exciting new possibilities that will play a big part in whatever's to come for search in the future.