Sunday, July 31, 2016
Friday, July 29, 2016
How to optimise your videos for better ranking on YouTube
With more than a billion users, and billions of daily video views, gaining user attention on YouTube may seem a daunting prospect.
However, the sheer size of the audience (a third of all web users) means that the rewards are there if you get it right.
In this post, I'll look at some of the factors which determine YouTube video rankings, some tips to help improve visibility, and some of the factors behind how Google chooses to show videos in its search results pages.
On-site YouTube ranking factors
I've split this into visible and invisible factors, i.e. those that can be seen by general users and those used for internal purposes.
Thanks to PI Datametrics for their help in compiling these ranking factors.
Invisible ranking signals
- Video file name. This is used when attempting to categorise the content, so be sure to label it using target keywords.
- View density. We can all see how many views videos attract over time but view density matters to YouTube. If your video receives a lot of views in a short space of time, it's more likely to be pushed up the rankings. This can be visible, but most brands don't show this. John Lewis does, and here are the stats for the last Christmas ad.

- Meta tags. YouTube's spiders rely on tags to interpret a video's content. This is thought to be a big factor in determining the positions a video is able to achieve in YouTube. When you upload a video to YouTube you can tag it with your keywords. 6-8 tags are thought to be the ideal amount. Look at the most popular/top tags on YouTube for your topics, and learn from them.
- Watch time. YouTube used to use view counts and comment volumes as factors, but changed this to watch time in 2012 as the previous factors could be gamed relatively easily.
- Flags / reports. These are negative factors which could harm your video's visibility.
Visible ranking signals
- Title. The maximum character limit is 100 characters. Use them well, place keywords towards the front of the title. As with a writing a good headline, titles need to be descriptive and compelling. The video should also deliver on the headline. If you over-promise, people won't spend time with the video, share it etc.
- Description. There are 5,000 characters to play with here, but only the first (roughly) 150 will be visible to people when they land on your page, so these have to work well. This is also an opportunity to add a link back to your site or target landing page.
- YouTube subtitles, closed captions and transcripts. These make the videos accessible to a wider audience.
- HD videos. HD quality videos are preferred to lower picture quality ones, though this does not mean that lower quality homemade videos don't work at all.
- In-video annotations/YouTube cards: Annotations allow you to add linkable text to a video; including notes, calls to action, and links to related video assets. This serves to build greater authority and encourages CTR, views and shares. YouTube developed 'annotations' in 2015 to include 'Cards' which are better looking version of annotations. The big difference is they work better across screens, and especially on mobile.
- Thumbnails. Not a ranking factor, but a well-chosen thumbnail should help to improve click through rates and increase views. The ideal size = 640 x 360 pixels minimum, 16:9 aspect ratio.
- Likes and dislikes. These provide an indication of the engagement around a video.

- Comments. These provide a way for YouTube to gauge the authority and relevance of videos. Not as significant a factor as before, perhaps because the comments on many YouTube videos are likely to test your faith in humanity.
- View counts. Again, not as influential a factor as in the past, but still an important indication of popularity.
YouTube channel factors
A distinct YouTube channel can help give brands (or anyone) a longer term and more effective YouTube presence. There are some useful tips on this from YouTube.
- Focus on content. Content needs to match the brand and give customers a clear indication of what to expect from your channel.
- Keep it simple. Branding should communicate the message behind your channels, so make sure videos, channel trailers etc align with this.
- Make it discoverable. Your branding should help people to find your videos and channel. This means consistent titles, tagging, descriptions and themes.
- Channel views. As with video views, the channel stats will contribute towards your rankings.
- Vanity URLs. Not a ranking factor, but something that should help improve other ranking signals by making your channel more easily discoverable.For example, Sainsbury's has https://www.youtube.com/user/Sainsburys. This helps to give the brand nice and neat results in Google:

- Subscribes. If people have subscribed to your channel after watching your video, this indicates to YouTube as well as to Google that your video is authoritative.
- Bookmarks. Another factor is the number of people who add your video to their 'watch later” list.
- Social shares. This is another factor which indicates the quality and engagement around your video.
- Backlinks. Links back to your channel or embeds of your video carry weight, and are a further ranking factor.
Branding example: Sainsbury's
Though John Lewis is better known for its Christmas ads, rival retailer Sainsbury's manages to out-perform it in terms of YouTube visibility.
This detailed post from PI Datametrics explains in more detail, but Sainsbury's is more consistent with branding, produces more content, and seems to work harder to optimise it.
Tips for improving YouTube performance
Learning from the ranking factors listed above will do a lot, but here's a few more tips:
- Promote videos through your own channels. Using your YouTube videos in emails, promoting on social sites, and embedding on your own website will all help to build momentum around your video content.eSpares is a great example of this. It creates videos around fixing DIY problems, posts them to its YouTube channel and uses them onsite by embedding them. This way it gets full value from its video content.
- Create video content which addresses user needs. Think about the questions customers will have around your product and service. Do some keyword research to find out the relative popularity of these terms.This is what eSpares and others do, this helps them attract views from target audiences, and a side bonus is that videos will often appear in the SERPs.

- Encourage comments. As comments contribute to your ranking, it's a good idea to do as much as you can to encourage a discussion underneath your videos. This could be by creating content which is likely to attract comments, or simply by asking people to comment.
- Use YouTube analytics. Data is your friend, so use it to see how your videos are performing, which are performing better than others, which attract most comments / likes etc.

All this data can help you to learn from what does and doesn't work, and to improve the effectiveness of your video content.
Thursday, July 28, 2016
Digital Altitude Review

There are two main reasons for this. First, there are millions of online resources each of which claiming to hold the key to ultimate online business wealth. Unfortunately, over 90% of these resources contain ineffective strategies on how to start and run a digital business. Second, with the countless digital business models available today, a new online marketer might find it hard deciding which to follow and profit from. He or she usually ends up wasting time on trying out different models before finding the right one.
But what if you found a company that solves both of these problems for you?
This Digital Altitude review looks at one of the internet's top digital business incubators. What is Digital Altitude
It's a company that was founded by former US Marine turned digital business expert Michael Force. The company focuses on providing training and tools to build a successful online business to ordinary people. It's 8 member team has over 100 years combined experience in the field of digital marketing. The company provides 6 different products each tailor made for a specific phase in the growth of a successful digital business. Michael Force scam is often found online in a search, but have to judge for yourself. Lets talk products and we'll start with Michael Force Aspire.
Digital Altitude products 
The company offers aspiring digital entrepreneurs 6 product packages. Here's a brief description of each.
1. Aspire
This product is for the aspiring digital marketer. If you wish to start an online business but have no idea where to start or, which business model is best, this package will get you started. Some of the components of this product package include:
– Over 60 digital business training video
– One on one consultation with your private business coach
– Sales funnels, websites and automation tools
– Networking, coaching and live events among others
This product is designed to get you started through training and, make money as you learn through sale of high commission products. The great thing is that you can join Aspire for only $1.
2. Base
Many of the digital businesses fail within a few months of launching. The Base product is designed to take you through the necessary steps to increase chances that your new online business succeeds. It's broken down into 3 stages; prepare, launch and, grow. It includes video courses that take you through the crucial stages your business needs to go through in order to succeed.
3. Rise
This product provides the tools, shortcuts and mindset you need to become a successful digital entrepreneur. It provides all the tools that you'll need in order to launch and build any online business from scratch. The product includes video tutorials broken down into 5 sections which include:
– Commit
– Customer
– Create
– Words
– Partner
By going through each section, you'll be able to identify your target customer, create content and sales copy that influences the target customer and, build partnerships that increase sales volume and profits.
4. Ascend
This is a 3 day all inclusive workshop for two. The workshop offers you the opportunity to meet some of the world's top influencers in digital business and learn from them. This three day workshop covers 3 main agendas. The first agenda covers traffic generation strategies and secrets. Agenda two covers branding your business and becoming an influencer in your field. The third agenda covers advanced techniques to increase conversions and increase profits.
5. Peak
This product targets digital entrepreneurs who've already built successful online businesses and want to move to the next level. It's a 5 day all inclusive retreat for 2. The agenda's covered on each day are as follows:
– Scaling a digital business
– Management, accounting and other aspects of running a successful business
– Growing sales consistently
– Increasing business efficiency
– Learn best practices and which to avoid
6. Apex
This is a 7 day all inclusive retreat for 2 that's focused on the art of building wealth. The 7 agendas covered during the retreat include:
– Building systems to attain freedom
– Learn investing secrets Wall Street keeps hidden
– Intelligent investing
– Creating a wealthy person's mindset
– Building a solid foundation to wealth creation
– Protecting your wealth
– Real estate investment
How does it work?
The Digital Altitude Aspire program is at the lowest level and you can currently join at $1. Normally, there are three plans under Aspire; the Walker, Hiker and Climber. The plans cost between $37 and $127 per month. Depending on the plan you choose, you will earn commissions of between 40% and 60% in a single tier, two tier or three tier compensation plan.
The other products will cost a one time fee of between $597 and $27,997. If you subscribe to one of these packages, you'll receive 60% commission under a three tier compensation plan. For example, a single sale for an Ascend member will make them a total of $6000.
Pros of Digital Altitude
– The different products cater for digital entrepreneurs at different levels
– Current $1 signup allows you to try out the program and decide whether it works for you or not
– Step by step blueprint of how to start, grow and scale an online business
– Members get one on one support from successful digital business owners
– Other than Aspire, other products available after one time payment
– All the tools and strategies to create a successful business are provided along the way
– Members taught concept of attaining digital entrepreneur mindset which is a must for success
– Up to 60% commission earned on high ticket products
Cons
– Aspire members have a recurring monthly subscription model
Digital Altitude review conclusion
Now, your main concern right now would be whether Digital Altitude is legit and if you should join it. From the different Digital Altitude reviews online as well as the company's website and team, it's evident that they are a legit business. If you're looking for a digital business opportunity that will make you hundreds or thousands of dollars through marketing high ticket products, Digital Altitude is worth trying out. The $1 to join opportunity now gives you the chance to learn how to build a successful digital business with minimal investment and within a short span of time.
You can get started in Digital Altitude log in here and join our team and private Facebook group.
Marvin Sykes
The post Digital Altitude Review appeared first on M.A.S. Marketing Team.
Facebook image cheat sheet: maximum photo sizes for your branded page and ads
Our previously published guide to Facebook image sizes is well over two years-old and therefore long overdue for an update, and SO much has happened to the world's most popular social network (for now) since then…
- Brands and publishers have seen their organic reach repeatedly annihilated due to changes in Facebook's algorithm to favour friends' posts only.
- Facebook has introduced sooooo many new ad formats and targeting options that it's impossible to keep up with them all.
- Plus Facebook is becoming extra helpful in allowing regular users to cut through the Newsfeed noise.
However, as Larry Kim taught us this week in his post on how to improve organic Facebook reach, it is still possible to find your audience without having to break the bank.
This guide is designed to ensure that when Facebook users do see and interact with your brand, that you're all scrubbed up and as presentable as you possibly can be.
These are the correct dimensions, resolutions and features you need for optimising your Facebook channel, without the need of an overzealous parent spitting in a handkerchief and scrubbing your face till it's red.
In order to do this as accurately and up-to-date as possible (seeing as Facebook only just recently changed the layout of branded pages again) I'll be using examples from the FB Pages Sizes and Dimensions page from Yoconda. It's worth giving them a like to keep up-to-date. And I'll be using the helpful advice from Miranda Miller in her original guide.
Facebook page
The top of your Facebook page as of July 2016 will now look something like this…
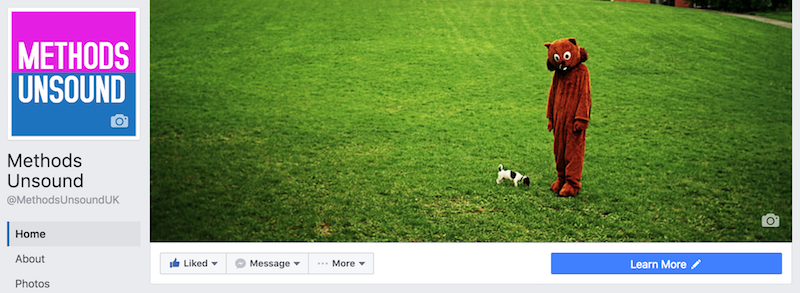
Let's break down the measurements…
Facebook header image

The optimal image size for your header image is 851 x 315 pixels. Any less and you'll lose resolution. Start with a canvas of double that size – 1702 x 630 – for sharp, crisp images; Facebook will resize it and you'll have the right dimensions.
The mobile safe area is 563 x 315 pixels.
Follow these dos and don'ts of header images:
- Do use a unique image to represent your page.
- Do experiment with different images to see which gets the best response.
- Do change up your image to highlight special events, seasonal trends, or other types of campaigns.
- Don't include any content that may be deceptive, misleading, infringe on anyone else's copyright, or violate Facebook's Pages Terms.
- Don't encourage people to upload your cover image to their personal Timeline.
- Don't make more than 20% of your cover image text.
- To get the fastest load times for your Page, upload an sRGB JPG file that's less than 100 kilobytes.
- For images with your logo or text content, you may get a higher quality result by using a PNG file.
Facebook profile picture
Your profile picture will be displayed at 160 x 160 pixels but must be at least 180 x 180 pixels to upload.
Pictures of different dimensions can be cropped upon uploading.
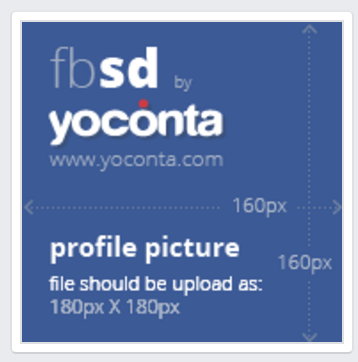
Also note that the profile picture no longer partially obscures the header image like it used to, so you can no longer do those 'fun and amusing' combinations
Your profile picture appears around Facebook wherever you interact with users and in their Newsfeed at 90 x 90 pixels so your profile picture must be legible at this resolution.
Shared link image
The image that's automatically pulled in from a link you've shared, or the one you'v uploaded an alternative image from your desktop will appear on your timeline and in the Newsfeed as 476 x 249 pixels.

Facebook ads
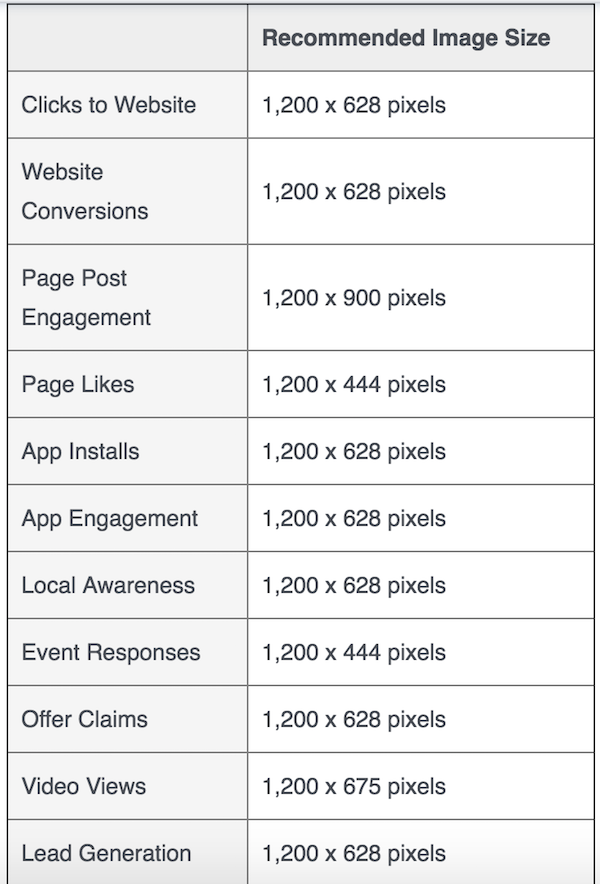
Facebook Ads images also have their own set of rules:
- Must be relevant and appropriate to the advertised product.
- May not exploit political, sexual or other sensitive issues.
- May not be overly sexual, imply nudity, show excessive amounts of skin or cleavage, or focus unnecessarily on body parts.
- May not portray nonexistent functionality, including but not limited to play buttons that suggest video capability and close buttons that do not close.
- May not contain QR codes.
- May not use Facebook brand images without permission, including but not limited to logos, icons and alert notification graphics.
- Images targeted to users under 18 must be appropriate for that age group.
- May not include images made up of more than 20% text, including logos and slogans. Note: this does not apply to pictures of products that include text on the actual product. Photos of products in real situations or photos of products with a background are acceptable. Images that are zoomed in on logos or images with text overlay are not allowed.
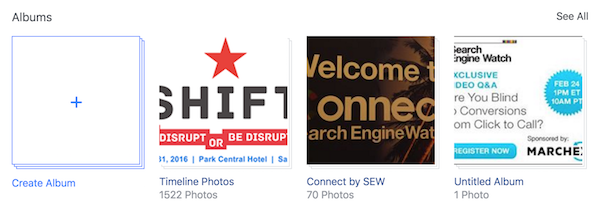
Facebook photo albums

Tuesday, July 26, 2016
17 useful search marketing stats from Merkle's Q2 2016 report
This morning, Merkle released their quarterly Direct Marketing Report, ahead of Google's own Q2 earnings announcement and it makes for a bumper stat-filled reading.
Of particular note are the revelations that:
- Google search spending growth has slowed to 22% as CPCs fall 9%
- Desktop PLA growth rate jumps while mobile growth is strong but slowing
- Shopping Ads traffic from Google image search and Yahoo surges
- Google's expanded text ads have had only a modest impact
The report covers the latest trends in paid search, organic search, social media, display advertising, and comparison shopping engines, so let's cherry-pick some of the highlights…
Paid Search
- Advertiser spending on Google paid search grew 22% Y/Y in Q2 2016, a slight deceleration from 25% growth in Q1.
- Click growth increased slightly to 34%, but CPCs fell 9%.
- Spending growth for Google text ads slowed to 10% Y/Y as CPC growth for brand keywords fell from 10% in Q1 to 0% in Q2.
- Google Shopping Ad spending growth rose to 43% as an influx of partner traffic bolstered total click volume.
- Combined spending on Bing Ads and Yahoo Gemini search ads fell 17% Y/Y as click declines continued to worsen.
- Bing Product Ad spending fell for the first time since the format's launch, likely the result of Yahoo moving to show more Google PLAs.
- Phones and tablets produced 53% of all paid search clicks in Q2, the same rate as a quarter earlier, but up 12 points from a year earlier. Google's share of clicks from mobile increased slightly to just over 57%
Organic Search & Social
- Organic search visits fell 7% Y/Y in Q2, down from 11% Y/Y growth a year earlier, as organic listings face increased competition from paid search ads, particularly on mobile.
- Mobile's share of organic search visits rose to 46%, but that still lags behind the 53% of paid search clicks that mobile produces, as well as the 47% share that mobile produced for organic search a year ago.
- Google produced 86% of all organic search visits in the US and 90% of mobile organic search visits.
- Google's share of mobile organic search has increased by nearly two points in the past year.
- Social media sites accounted for 2.8% of site visits in Q2 2016, with Facebook producing 63% of all site visits driven by social media.
Comparison Shopping Engines
- The eBay Commerce Network commanded a majority of advertisers' comparison shopping engine (CSE) spending for the first time in Q2. Along with Connexity, the two dominant CSE platforms accounted for 97% of all CSE ad spending.
- Advertiser revenue produced by eBay Commerce Network and Connexity listings grew by 33% and 23% Y/Y respectively; however, the two platforms combined for less than 10% of the revenue produced by Google Shopping Ads, among advertisers participating in all three platforms.
Display Advertising
- Total display advertising spending grew 62% Y/Y, driven by very strong results from Facebook, where Merkle advertisers increased their investment by 121% Y/Y.
- Retargeting accounted for 62% of all display spending in Q2.
- The Google Display Network (GDN) also delivered spending growth, with advertisers seeing its share of total Google ad spending increase to 12%.
Monday, July 25, 2016
Friday, July 22, 2016
Google launches imported call conversions
If the internet killed the phone call, the smartphone has revived it.
While more and more business is conducted without human interaction, there are still times customers need to reach a business by phone and mobile click-to-call is on the rise.
According to data from BIA/Kelsey, calls to US businesses from smartphones will hit 162 billion in the next three years, a jump of nearly 75% since 2015.
For businesses that derive revenue in some way from those phone calls, attribution can be a challenge.
Those using adding a phone number to their Google AdWords ads or running call-only campaigns have up until now been able to track conversions in a rudimentary fashion only.
Specifically, Google's conversion tracking has enabled advertisers to track when AdWords ads result in calls of a minimum length.
But recognizing that this offers a limited view of conversions, Google has announced imported call conversions, a new feature that allows advertisers to import call data so that they can attribute detailed conversion data, such as revenue generated, back to the calls generated by their AdWords campaigns.
As Amit Agarwal, Google's senior product manager for Mobile Search Ads, explained:
“You can also distinguish between various types of customer actions that you may value differently. For example, the travel advertiser might assign revenue amounts to different call types like new bookings, rate requests, service calls, and customer upsells to a larger trip package.”
The data from imported call conversions can be used with Google's target return on ad spend (ROAS), an automated bidding strategy that is designed to help advertisers realize an average return on ad spend that they specify across all of their campaigns, ad groups and keywords.
To import call conversions, advertisers must minimally supply a phone number, call start time and call length. Custom conversion events can be defined, and for each, advertisers can specify an optional conversion time, conversion value and conversion currency.
Already, Google says advertisers using imported call conversions are using the data to realize significant gains in their campaigns.
Insurance provider Nationwide, for instance, says that “since including imported call conversions into campaign optimization, we've been able to increase spend on top-performing, call-driving terms by nearly 3x. This has even helped us identify new keyword expansion opportunities from search queries we wouldn't have otherwise found without increasing our investment backed by imported calls data.”
Thursday, July 21, 2016
M-commerce: has the mobile web finally won?
Not only are more smartphone users purchasing with their mobile devices, but more people are choosing to make those purchases via mobile web rather than via mobile apps.
These figures come from the latest European data from ComScore (July 2016), and echoes similar findings in a survey of US shoppers by Forrester (August 2015).
This underscores the imperative of striving for excellence in mobile web commerce, not just to facilitate purchases on the small device; but also to help drive onsite (instore, in-restaurant etc.) purchases – in which, we will also see, mobile web plays a critical role.
However, while web will be the route to serving the majority of your mobile customers, this does not necessarily prohibit investment in a mobile app.
Those retailers which have a sufficiently large core of extremely loyal and very regular mobile shoppers who will download, retain and use a mobile app, may be able to justify the very significant expense of developing, promoting and maintaining a separate mobile channel.
Let's take a look at those numbers…
In Q1 2016, the proportion of smartphone users in the EU5 countries who made a purchase online was:
- 33.8% in the UK
- 28.3% in Italy
- 19.2% in Germany
- 14.5% in Spain
- 13.5% in France
This is according to research by ComScore (July 2016). Smartphone penetration in these countries ranges from 69% in Italy to 81% in France.
In every one of these five countries, more people purchased via mobile web than mobile app.
The number of smartphone users purchasing by mobile web was only 1% higher than by app in the UK, but was 8% more in Germany, 22% more in Italy, 23% more in Spain and 25% more in France, ComScore's data found.
The mobile customers to the website and app of Eurostar, the high-speed rail link between London and Paris or Brussels tally with ComScore's stats.
Neil Roberts, Head of Digital at Eurostar:
“We see about 5% higher traffic on mobile web vs app – so very similar trend. Although conversion tends to be higher on the app, as you would imagine as they are more engaged having committed to download the app.”
This isn't just a European trend
A survey of US consumers conducted by Forrester/RetailMeNot (PDF) (August 2015), found that 43% of respondents had purchased by mobile browser in the previous quarter compared to just 30% who had purchased by app.
The important thing to note about the Forrester research is consumers don't just prefer mobile web over apps for purchases, but for almost every retail-related activity.
This includes tasks that drive in-store purchases: locating a store; reading reviews; comparing prices; finding coupons; checking product availability; redeeming coupons; and checking out an instore promotion.
However much we celebrate the growth of online retail and the mobile share thereof, we should never forget that physical stores are still the dominant retail channel. In the US, physical stores still account for 90 percent of market share, according to the National Retail Federation (NRF).
The tricky thing is how retailers attribute/credit those the mobile web for its valuable role in driving those in-store sales. [But this fascinating topic of cross-channel attribution will have to wait for a future column].
Do retailers see more traffic from mobile web over apps?
It's difficult to get a broad picture as many retailers are secretive about their mobile sales, and particularly about the breakdown between app and web. We can only speculate why this might be!
But if the UK's Shop Direct is a benchmark then mobile web attracts considerably more traffic.
Shop Direct is one of mobile's big success stories. The online-only electricals to fashion retailer concentrated on steadily building its mobile web business, before expanding into developing mobile apps.
This is a strategy that appears to be paying dividends: 59% of the retailer's £1.8bn annual sales now comes from mobile devices (that's smartphone and tablet).
Sam Barton, head of user experience (UX) at Shop Direct, tells ClickZ:
“The MyVery app currently makes up around 10% of our demand from mobile devices. We launched the app on iOS at the end of 2014 and on Android in July 2015. It now has over 900,000 downloads, and allows us to engage and interact with our customers in new and innovative ways.”
Compared with Shop Direct, UK retailers as a whole have been slower to capitalize on the m-commerce opportunity, with one third of top retailers still without an m-commerce site. But retailers do appear to prioritize mobile web over mobile app.
According to Internet Advertising Bureau, (March 2015) 64% of the top UK retailers (measured on digital ad expenditure) have a transactional mobile site, while only 32% had a transactional app.
Mike Reynolds , mobile manager, IAB UK:
“It's not easy for a brand to get some prime real estate, in the form of an app, on someone's phone. They have to compete with social media, gaming and news brands etc. which get more traction as they tend to be used daily and are engrained in people's mobile behavior.”
My understating is that retail apps tend to be used as a retention tool.
This means by their nature, they will have a smaller, more loyal, audience than mobile sites, which are more discoverable through mobile search and social media.
Don't dump your apps plans just yet
Research from Criteo (Q4 2015 Report) suggests a different story to ComScore and Forrester.
It finds that apps account for 54% of mobile sales among its clients, ahead of mobile browser 46%.
So how do we explain this apparent anomaly?
Whereas ComScore and Forrester conducted surveys of consumers, Criteo's research is based on companies that use its digital advertising services. It is unclear if this is representative of global ecommerce sales. Some of the stats are surprisingly high, including the finding that in the UK mobile is 50% of ecommerce sales.
Leaving these reservations aside. Criteo's stats are based on numbers of transactions rather than unique users.
If accurate, then while more people use mobile web to shop, mobile app users buy more. A lot more: Criteo believes mobile app conversion rates are not just higher than mobile web, but higher than desktop also.
So why might apps deliver better conversions than mobile web? We can speculate several possible reasons:
- As only a retailer's loyalist customers will download your app, these are also likely to be the biggest spenders.
- Purchasing on a retailer's native apps is preferable to the retailer website. Retailers will often invest more in a) developing apps to deliver better features and personalization than online; b) promoting the app; and c) will offer exclusive features, promotions, pricing and products that are not available via other channels.
- Retailers are able to drive more repeat purchases using in-app notifications (which until recently were only available in native apps).
The problem with apps
The thing about native apps is customers can only use them if they have been downloaded to their smartphone. Research by the PEW Research Centre (November 2015) found that 77% of US smartphone users download apps, of these 30% had downloaded less than 10 apps to their handset and a further 32% had downloaded less than 20.
Many apps going unused: only 16% used more than 10 apps on a regular basis.
The following graph shows the top 25 apps in the US, according to ComScore (September 2015). There no retailers in the top 10. One, Amazon, in the top 20. Three, Amazon, eBay and Walmart in the top 25.
Some of these apps come pre-installed, but it still well illustrates the monumental challenge faced by any retailer to find its app a space on a customer's smartphone.
This is well illustrated by the Forrester research, which finds that 60% of recipients had two or less retailer apps on their handset (21% had none).
Yoram Wurmser, analyst, eMarketer:
“Most people will only use an app for Amazon or their favorite retailer/s, say Sephora or Nordstrom. For most of their shopping, they'll use the web, but the minority that use apps will be the best customers who are predisposed to buy often and with bigger baskets.
This doesn't necessarily mean that most retailers should build an app. But if they have a dedicated customer base and a clear use case, it can make sense.”
Now let's talk reach
For most retailers, commerce is a numbers game. Unlike publishers that earn money from ads, it doesn't matter how long people hang-around, it's about how many people pop in and how many products they walk away with (paid-for).
When it comes to numbers even for the biggest players, mobile web delivers lots more visitors than apps. The following ComScore (September 2015) graph isn't commerce specific, it compares the top 1000 mobile web properties and the top mobile app properties in the US.
The mobile web audience is 2.5 times bigger and growing faster than apps.
Action
The ComScore and Forrester research shows that customers are not just willing to use their smartphones to purchase but they are more likely to do so by mobile web than mobile app.
This underscores the imperative of striving for excellence in mobile web commerce, not just to facilitate purchases on the small device; but also to help drive onsite (instore, in-restaurant etc.) purchases.
Your competitive edge and route to better conversions will be delivering a mobile-first, user-centric m-commerce site that harnesses the best of the native app with all the accessibility and versatility of the mobile web.
Barbara Ballard, director of research, Radius:
“Don't skimp on features for mobile web – people won't want to download an app just to buy.”
Read the entire report here: DNA of a Great M-Commerce Site Part 1: Planning
Wednesday, July 20, 2016
Five simple user experience tweaks for better conversion
Sometimes the functionality and user experience (UX) on a website can make or break a business.
Things like mobile optimization or page load-time are talked about so often in the SEO world purely because a user will have no hesitation leaving if they are not having a positive experience on your website. It's that simple.
That being said, not all “good” websites are created equal.
The more research that is done on user experience, the more we learn about optimizing for better conversion results, and the more we realize that user experience is more than just a fast site that seems simple to use.
Five tweaks that improve user experience
GoodUI.org constructed a project on user experience and has developed 75 “good ideas” that produce amazing results when it comes to UX.
All the data has come from real websites and brands/businesses that have decided to share their data for project analysis on user experience. Reading some of their tips was like finding gold.
After looking over their ideas, along with other recent research, below is a list of five user experience tweaks that you can make to see better conversions because of improved user experience that so many are still missing:
1) Optimize the “repetition” of call-to-action buttons
One of the most impressive discoveries has been in regards to repetitive layouts with CTA (call-to-action) buttons.
The only thing that was changed in these tests from a control page was an additional CTA button at the bottom of the page as well as the top of the page.
In the data set that GoodUI developed, this was shown to have an 84% median effect for conversion on product pages. So, rather than just having the CTA button that you want users to click at the top of the page, add and additional CTA at the bottom and you are much more likely to see results.
The screenshot below shows the study's results:

2) Social testimonials = business descriptions and content
User engagement is a huge part of ranking organically, so the more you can get people talking about your brand in a positive way, the better it is for your SEO. Why not use this to your advantage?
One of the best ways that you can improve user experience is to use social testimonials on your site rather than solely providing descriptions that you have written.
Testimonials have been proven to help conversions because users feel as though they can trust the experience of others. This one tweak can make a substantial difference for how your brand is perceived.
Take for example this beautiful Xero Accounting Software testimonial page:
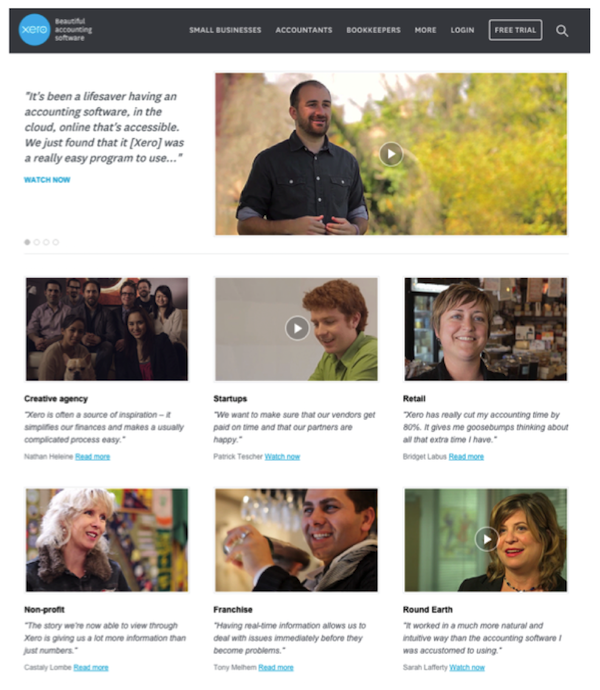
Visitors can click through videos and hear directly from other users about their experience with the product and see quotes immediately next to the video.
This is a really great way to use social testimonial rather than talking about the positive aspects of your product or service yourself.
The videos from Xero are also really high quality and show that they are committed to telling the story and perspective of their clients, which is really impressive to people who are deciding whether to give you their business.
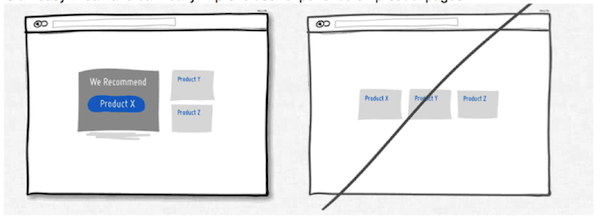
3) Recommend products or services (over others you offer)
Have you ever been at a restaurant where something is highlighted as a staff or chef recommendation on the menu? Or perhaps you've come across an item that is a “popular” choice by others?
Recommending a certain product or service over an equal display has been shown to increase conversion.
When people are given too many choices they can often have a difficult time making a decision. When this situation occurs, people are often likely to turn to recommendations and are more likely to follow-through with a purchase.
If your company offers a variety of products or services this may be something you want to consider. It is an easy tweak and can really improve user experience on product pages.
4) Provide fewer fields to fill out
If you want to get more people signed-up or on your mailing list, sometimes the best way to go is actually fewer fields at once.
In many cases you can eliminate fields and still get the information that you need.
Ask what is really necessary to get a visitor on your email list (it is usually just their name and email) and consider moving other question fields to another area after they are signed up.
This particular user experience tweak was shown to have a +7.6% medium effective rate. The result when altering this format (vs a control with multiple fields) was +53% more quotes with fewer fields.
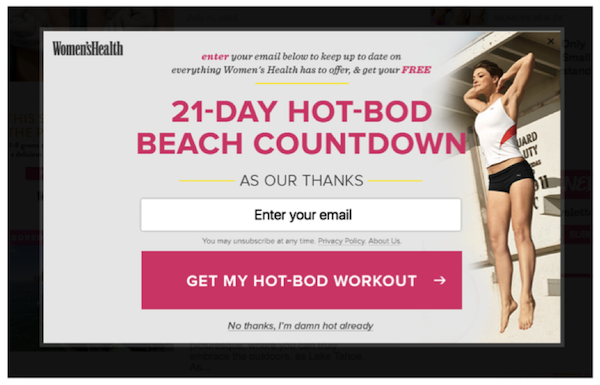
In the example from Women's Health magazine above, all the site asks for (at least initially) is the visitor's email in order to get access to a 21-day workout. This is the perfect way to get people on your mailing list without bombarding them with too many fields to fill out.
5) Clean layout and fewer borders
Lastly, one of the most successful tweaks you can make is having a clean layout with fewer borders. So many sites have side bar, top bar, bottom bar options… and it can be totally overwhelming for users to navigate the site.
Remember, the goal is to direct people where they should go without all of the guesswork. Take for example the website layout below:

The site utilizes a clean and focused format, which draws the visitor to the action they want them to take.
For example, they present a few pieces of content and then ask the user to “scroll down or die.” By doing this they can use an infinite scroll form and not require the user to have all of the information in their immediate visual field. This obviously makes things a lot clearer and intentional.
Borders compete for attention with real content-plain and simple. There is really no reason to overwhelm a user with them, and in fact, you are more likely to get a positive result from visitors in terms of conversion if you adjust to a cleaner presentation.
What do you think of these tweaks? Do you intend to implement any of these yourself? Let us know in the comments section below-we would love to hear from you!
Amanda DiSilvestro is a writer for HigherVisibility, a full service SEO agency, and a contributor to SEW. You can connect with Amanda on Twitter and LinkedIn.
Monday, July 18, 2016
The 10 greatest social media advertising tips for content marketers
Let's start with the bad news first. It's tougher than ever to get your content noticed.
Changes to Google's search results pages have further obscured content organically, especially on competitive commercial searches. Meanwhile, paid search CPCs are at all-time highs in established markets.
Organic reach in social media? It's pretty much dead. Half of all content gets zero shares, and less than 0.1 percent will be shared more than 1,000 times. And Facebook just announced that you're even less likely to get your content in front of people who aren't related to you. (Sorry.)
Additionally, the typical internet marketing conversion rate is less than 1 percent.
How content marketing doesn't (usually) work
How does content marketing actually work? Many people believe content marketing is basically a three-step process:
- Create new content.
- Share your content on social networks (Facebook, Twitter, LinkedIn, etc.).
- People buy your stuff.
Nope. This almost never happens.
Most content goes nowhere. The consumer purchase journey isn't a straight line – and it takes time.
So is there a more reliable way to increase leads and sales with content?
Social media ads to the rescue!
Now it's time for the good news, guys! Social media ads provide the most scalable content promotion and are proven to turn visitors into leads and customers.
And the best part? You don't need a huge ad budget.
A better, more realistic process for content marketing would look like this:
- Create: Produce content and share it on social media.
- Amplify: Selectively promote your top content on social media.
- Tag: Build your remarketing audience by tagging site visitors with a cookie.
- Filter: Apply behavioral and demographic filters on your audience.
- Remarket: Remarket to your audience with display ads, social ads, and Remarketing Lists for Search Ads (RLSA) to promote offers.
- Convert: Capture qualified leads or sale.
- Repeat.
You can use the following 10 Twitter and Facebook advertising hacks as a catalyst to get more eyeballs on your content, or as an accelerant to create an even larger traffic explosion.
1. Improve your Quality Score
Quality Score is a metric Google uses to rate the quality and relevance of your keywords and PPC ads – and influences your cost-per-click. Facebook calls their version a “Relevancy Score”:
While Twitter calls theirs a “Quality Adjusted Bid”:
Whatever you call it, Quality Score is a crucial metric. You can increase your quality score for Twitter and Facebook by increasing your post engagement rates.
A high quality score is great because you'll get a higher ad impression share for the same budget at a lower cost per engagement. On the flip side, a low Quality Score is terrible because you'll have a low ad impression share and a high cost per engagement.
How do you increase engagement rates? Promote your best content – your unicorns (the top 1-3 percent that performs better than all your other content) vs. your donkeys (your bottom 97 percent).
To figure out if your content is a unicorn or donkey, you'll have to test it out.
- Post lots of stuff (organically) to Twitter and use Twitter Analytics to see which content gets the most engagement.
- Post your top stuff from Twitter organically to LinkedIn and Facebook. Again, track which posts get the most traction.
- Pay to promote the unicorns on Facebook and Twitter.
The key to paid social media ads is to be picky. Cast a narrow net and maximize those engagement rates.
2. Increase engagement with audience targeting
Targeting all of your fans isn't precise. It's lazy and you'll waste a lot of money.
Your fans aren't a homogenous blob. They all have different incomes, interests, values, and preferences.
For example, by targeting fans of Donald Trump, people with social media marketing job titles, NRA members, and the hashtag #NeverHillary (and excluding Democrats, fans of Hillary Clinton, and the hashtag #neverTrump), this tweet for an Inc. article I wrote got 10x higher engagement:
Keyword targeting and other audience targeting methods help turn average ads into unicorns.
3. Generate free clicks from paid ads
On Twitter, tweet engagements are the most popular type of ad campaign. Why? I have no idea. You have to pay for every user engagement (whether someone views your profile, expands your image, expands your tweet from the tweet stream, or clicks on a hashtag).
If you're doing this, you need to stop. Now. It's a giant waste of money and offers the worst ROI.
Instead, you should only pay for the thing that matters most to your business, whether that's clicks to your website, app installs, followers, leads, or actual video views.
For example, when you run a Twitter followers campaign you only pay when someone follows you. But your tweet that's promoting one of your unicorn pieces of content will also get a ton of impressions, retweets, replies, mentions, likes, and visits to your website. All for the low, low cost of $0.
4. Promote unicorn video ads!
Would you believe you can get thousands of video views at a cost of just $0.02 per view?
Shoppers who view videos are more likely to remember you, and buy from you. A couple quick tips for success:
- Promote videos that have performed the best (i.e., driven the most engagement) on your website, YouTube, or elsewhere.
- Make sure people can understand your video without hearing it – an amazing 85 percent of Facebook videos are watched without sound, according to Digiday.
- Make it memorable, try to keep it short, and target the right audience.
Bonus: video ad campaigns increase relevancy score by 2 points!
5. Score huge wins with custom audiences
True story: A while back I wrote an article that asked: do Twitter Ads work? To promote the article on Twitter, I used their tailored audiences feature to target key influencers.
The very same day, Business Insider asked for permission to publish the story. So I promoted that version of the article to influencers using tailored audiences.
An hour later, a Fox News producer emailed me. Look where I found myself:
The awesome power of custom audiences resulted in additional live interviews with major news outlets including the BBC, 250 high-value press pickups and links, massive brand exposure, 100,000 visits to the WordStream site, and a new business relationship with Facebook.
This is just one example of identity-based marketing using social media ads. Whether it's Twitter's tailored audiences or Facebook's custom audiences, this opens a ton of new and exciting advertising use cases!
6. Promote your content on more social platforms
Medium, Hacker News, Reddit, Digg, and LinkedIn Pulse call all send you massive amounts of traffic. It's important to post content here that is appropriate to the audience.
Post content on Medium or LinkedIn. New content is fine, but repurposing your content is a better strategy. This will give a whole new audience a chance to discover and consume your existing content.
Again, you can use social media ads as a catalyst or accelerant and get hundreds, thousands, or even millions of views you otherwise wouldn't have. It might even open you up to syndication opportunities (I've had posts syndicated to New York Observer and Time Magazine).
You can also promote your existing content on sites like Hacker News, Reddit, or Digg. Getting upvotes can create valuable exposure that will send tons of traffic to your existing content.
For a minimal investment, you can get some serious exposure and traffic!
7. Optimize for engagement for insanely awesome SEO
RankBrain is an AI machine learning system, which Google is now using to better understand search queries, especially queries Google has never seen before (an estimated 15 percent of all queries).
I believe Google is looking at user engagement metrics (such as organic click-through rates, bounce rates, dwell time, and conversion rates) as a way, in part, to rank pages that have earned very few or no links and provide better answers to users' questions.
Even if user engagement metrics aren't part of the core ranking algorithm, getting really high organic CTRs and conversion rates will have its own great rewards:
- More clicks and conversions.
- Better organic search rankings.
- Even more clicks and conversions.
Use social media ads to build brand recognition and double your organic search click-through and conversion rates!
8. Social media remarketing
Social media remarketing, on average, will boost engagement by 3x and increase conversion rates by 2x, all while cutting your costs by a third. So make the most of it!
Use social media remarketing to push your hard offers, such as sign-ups, consultations, and downloads.
9. Combine everything with super remarketing
Super remarketing is the awesome combination of remarketing, demographics, behaviors, and high engagement content. Here's how and why it works.
- Behavior and interest targeting: These are the people interested in your stuff.
- Remarketing: These are the people who have recently checked our your stuff.
- Demographic targeting: These are the people who can afford to buy your stuff.
Now you need to target your paid social ads to a narrow audience that meets all three criteria using your high engagement unicorns.
The result?
10. Combine paid search & social ads
For our final, and most advanced tip of them all, you're going to combine social ads with PPC search ads on Google using RLSA.
RLSA is incredibly powerful. You can target customized search ads only to people who have recently visited your site when they search on Google. It increases click-through and conversion rates by 3x and also reduces cost-per-click by a third.
But there's one problem. By definition, RLSA doesn't target people who are unfamiliar with your brand.
This is where social ads come in. Social ads will help more people become familiar with your brand.
Social ads are cheap way to start the process of biasing people towards you. Although they may not need what you sell now, later when the need arises, people will either do a branded search for your stuff, or do an unbranded search but click on you because they remember your memorable or inspirational content.
If your content marketing efforts are struggling, then these ridiculously powerful Twitter and Facebook advertising hacks will turn your content donkeys into unicorns!
Tuesday, July 12, 2016
Facebook ad targeting: every possible option available [infographic]
A couple of weeks ago, a “simplified” Facebook Ads Manager user interface arrived, merging what used to be several separate targeting boxes into one megabox.
Now demographics, interests, and behaviors all live within this one 'Detailed Targeting' box.
Everything from job titles, to life events, to industries, to purchase behavior, are all lumped together in here. Advertisers will have to find it all by hunting with autocomplete.
This change makes it much harder to know which ad targeting options are available. Are advertisers supposed to search blindly, just guessing what targeting options Facebook has?
There are literally tens of thousands Facebook ad targeting options that go beyond basics like age, gender, and language.
Seriously, just look at what happens just for the letter A. You get everything from “In a relationship,” to “Asia,” to “Less than $20,000.”
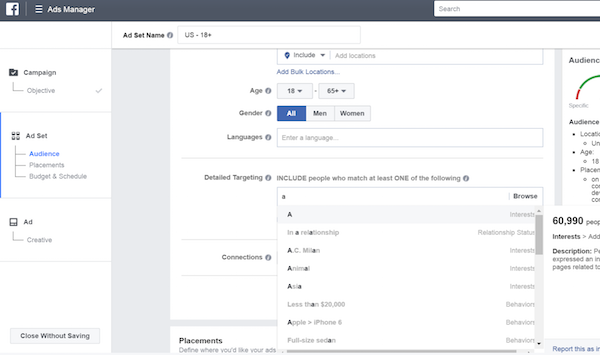
Detailed targeting used to be, well, more detailed! Facebook laid out the options in a much more logical and granular way for advertisers, many of whom already found Facebook advertising a bit overwhelming.
Isn't there a much better way? Yes! All hope is not lost!
A new infographic from my company, WordStream lays out every possible Facebook ad targeting option in one helpful infographic.
We've collected every single Facebook advertising option in the epic infographic below: demographics, interests, behaviors, connections, and remarketing.
Save it and use it as you're preparing and optimizing your next Facebook ads campaign. Take advantage of all these powerful combinations to reach your target audience on Facebook.


